 Today the IMF cast doubt on the Chancellor’s deficit reduction programme and new figures suggested that manufacturing activity had all but ground to a half. The news from the Office of National Statistics (ONS) last week that the UK economy grew by only 0.2% in the second quarter of 2011 – down from 0.5% in the first quarter – also made for grim reading. Anna Valero and John Van Reenen argue that the government should reverse some of the spending cuts, change immigration policy, and invest in public infrastructure in order to rebalance the economy and restore growth.
Officially we are told not to be worried because there are many “special factors” that are making the growth figures look worse than they really are. But these excuses often make little sense. True, the Royal Wedding kept people out of work but the celebrations boosted demand for many services (sales of ice cream, beer, union jack flags, etc.). Furthermore, these “special factors” are very persistent. It was only a few months ago that the 0.5% fall in growth for the last quarter of 2010 was blamed on snow clogging the (economic) lines. So what’s next? Bad Q3 2011 figures due to too many summer festivals and people saving for the Olympics?
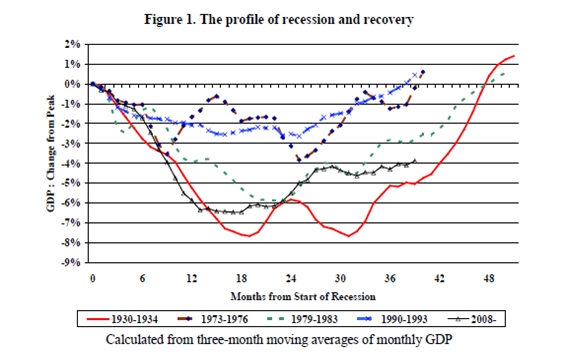
The truth is that British growth is poor compared to where it should be at this stage of the recovery. Figure 1 compares our growth rates with previous recessions. The recession starting in 2008 was the worst since the 1930s. And although for a while in 2010 it looked like things would be “only as bad” as the 1980s, since last summer growth has again stalled.

Source: NIESR, July 2011
Is extreme austerity the right medicine?
The normal policy prescription to this position would not be massive spending cuts and tax rises, but this is the medicine we are now swallowing. One of the Coalition’s first moves in July 2010 was an emergency budget which planned to suck 7% out of GDP by 2015/16 – a year earlier than Labour’s already tough plan of a 5% fiscal consolidation by 2016/17.
It is hard to tell for sure if the government’s cuts are the cause of anaemic growth, but the circumstantial case is building up. The cuts started to really bite in April in the new financial year. Consumers and businesses can see what is coming down the road and this is likely to be already reducing their spending and investment today.
But would we not be looking like Greece without the tough budget? This is vastly overstated – the UK has sovereign debt with long maturity value, levels that are not so unusual by historical standards, a history of stable debt servicing and a functioning tax system. Nor does the Chancellor’s boast that the July 2010 Budget has cut our borrowing costs stack up to the data. There has been no sharp break in bond yields after the election or after the July 2010 budget; the UK has followed the US closely.
Supply side pessimism: A self-fulfilling prophecy?
The other reason given for extreme measures is that the UK economy was built on the froth of a finance and property bubble which have now crashed. Our potential output has shrunk and our productivity growth is now permanently lower.
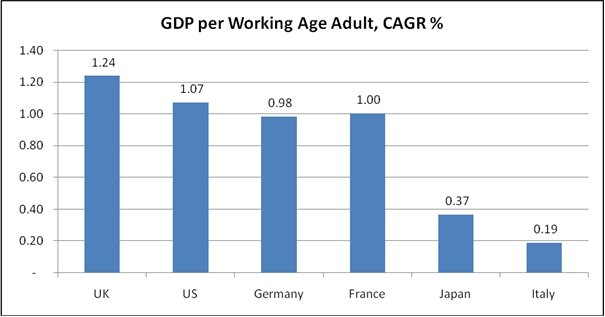
Those who make such claims with certainty are ignoring recent history. Far from being a basket case, the UK economy has had a faster growth of GDP per person than any of the major developed nations countries since Tony Blair’s election in 1997 even after we include the crisis years of 2008-2010 (see Figure 2).
Figure 2: Annual Average growth of GDP per working Age Adult, 1997-2010

Source: Authors’ analysis of Conference Board Total Economy Database, January 2011, http://www.conference-board.org/data/economydatabase/.
Notes: Total GDP, in millions of 2010 US$ (converted to 2010 price level with updated 2005 EKS PPPs). Data on working age adults from US Bureau of Labour Force Statistics, civilian population aged 15-64. CAGRs calculated using years 1997-2010 inclusive
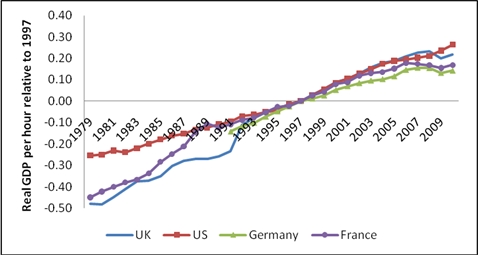
This strong performance was based on a productivity record that matched the US (during their “productivity miracle” period) until the Great Recession and an employment record that has been superior to America’s. And this hasn’t just been because of Labour’s reforms. UK productivity performance was also very strong in the Thatcher-Major years of 1979-1997 (see Figure 3).
Figure 3: GDP per Hour Growth 1979-2010

Source: Authors’ analysis of Conference Board Total Economy Database, January 2011, http://www.conference-board.org/data/economydatabase/.
Notes: Data for Unified Germany from 1991.
If we strip out the property (and public) sectors to focus only on the better measured market sector and the same picture emerges of strong UK performance (see Figure 4). Furthermore, although finance is important its role should not be exaggerated. If we break down the sources of the 2.8% annual productivity growth between 1997 and 2007 only 0.4% of this was due to finance (up from 0.2% in 1979-1997 and less than in the US). Business services accounted for 0.8% and distribution 0.7% – these are not the sectors which are obviously driven by bubbles in finance, property or government spending.
Figure 4: UK Productivity growth through 2007 was not mainly due to financial services: business services mattered much more

Source: Authors’ analysis of EU KLEMS data.
Notes: The bars show contribution of each sector to labour productivity (real value added per hour) growth in the market sector (dropping health, education and public administration from total economy). Sectoral growth rates are weighted by their share in market economy gross value added. “Reallocation” refers to the labour productivity effects of reallocations of labour between sectors that have different productivity. EU represents all EU-15 countries for which growth accounting could be performed, i.e. AUT, BEL, DNK, ESP, FIN, FRA, GER, ITA, NLD & UK. Data for France and EU are available from 1981 onwards.
The view that the economy has lost 7% or 10% of its output permanently has gained acceptance by the economic establishment but is not well grounded in the facts. Unfortunately as this pessimism takes hold it becomes self–fulfilling. If you believe the supply side pessimists, any retreat from extreme austerity becomes pointless as the economy is already near full capacity and demand will just stoke further inflation. Although inflation is high this is not due to domestic wage pressure: real wages have been falling since 2008 due to the flexibility of the labour market and this is a major reason for much lower unemployment today than in the 1980s and 1990s recession despite a larger fall in national output. Our inflation is mainly driven by increasing commodity prices due to a booming China and India and the price of oil – something that the UK has relatively little influence on. But the high unemployment and scrapping of physical and human capital that austerity engenders really will reduce the potential of the economy. And this is something we can make political choices about.
What to do? From Plan B to Plan V
Our analysis calls for a “Plan B” to the Chancellor’s current trajectory. There is no merit in staying the course if it’s leading you over the edge of the waterfall. The shadow Chancellor has called for a temporary cut in VAT. Tim Leunig has suggested bringing the £10,000 personal allowance forward a year. Our preference would be to restore some of the spending cuts in public investment. This would be easy to implement, would build up the UK’s infrastructure and would hardly spook the capital markets.
In terms of growth though, the bigger challenge is likely to be in the longer run: how do we rebalance and restore the economy to stronger growth? I have argued that we need to go beyond Plan B to a Plan V*. This certainly involves public infrastructure, but it requires a change in the way the government approaches the growth problem. It seems that the current approach is simply to assume that the economy will recover if we can get through the immediate crisis. But the government needs to be more far-sighted than this. It needs to scan ahead to where Britain has comparative advantage in the growth industries of the future and do its level best to remove barriers to the growth of these sectors and to at all costs avoid putting up new ones.
An example of the anti-Plan V is current immigration policy. The drastic reduction of visas for high skilled immigrants may cripple Higher Education, a growth sector where the UK enjoys strong market share in global foreign students. The US leads, but has seen its share fall after the Bush administration introduced a very stringent visa regime following 9/11. Plan V would strongly encourage the import of the best and brightest in the world.
Another Plan V policy is to encourage auctions of land in the South-East for commercial and residential use. Planning constraints around Cambridge, for example, are holding back the development of a strong and viable cluster of software and bio-tech firms. Successive governments have been too timid here and “localism” is likely to lead to greater Nimbyism.
Reducing the preponderance of “Horrible Bosses” is also part of a decent growth plan. The Centre for Economic Performance has accumulated much evidence that the UK has a deficit of good management and this is a cause of low productivity. There is much that can be done to rectify this (especially in the public sector) through policies towards tougher competition, removing tax distortions and building human capital.
* “V” was named for a V-shaped recovery rather than a W-shaped double dip recession. Plan V was also coined after the closing of Pfizer’s R&D lab in Sandwich which produced Viagra and many headlines about the need for a plan to uplift sagging UK growth.
Please read our comments policy before posting.


“I wonder how will the UK government deal with the crunch of international candidates and talent when they wont have people around them to fill up the right and available positions in the public and private organizations”
Perhaps train some of the 70 million people already living in the Uk, or otherwise recruit from the hundreds of millions of Europeans who are and would be available even within strict immigration rules (which we do not have anyway)
It definitely makes an international applicant think,who wishes to study further in the UK a thousand times.It is actually appalling,the way the government is looking at its course of action.Studying the trajectory of the growth so far and how it`ll perform in the future,it doesnt look very bright.
I wonder how will the UK government deal with the crunch of international candidates and talent when they wont have people around them to fill up the right and available positions in the public and private organizations.
I would say that the only viable future for those living in the UK is degrowth, an economy that is essentially localised, where local communities based on small towns decide how to satisfy their own collective needs using local currenciesand buying out only where there is either unmet need or where other resources are needed for those activities that are surplus to human need. Secondly, the greater part of the economy should work with and within the constraints imposed by the natural habitat, avoiding as much as possible artificial technologies that interfere
in and undermine both natural and human well-being.
The balance between nature and nurture will obviously have to be struck, and the modern invention of the autonomous ego will have to go, but the respect for the
spirituality of humans and of the natural creation will deepen the true sense of self
and self-giving mutuality, the diametric opposite to 300 years of Western ‘civiklisation’. Such an economy should be rooted in our deeper selves and in our habitat, but though this is the future acknowledged by such groups as the Transition town movement and the Green Party, it will take some years before
the destructive and tyrannical neo-liberal menace is dismantled. Certainly a return to a Keynesian national policy based on the nation-State and a reversal of regressive taxation would be the midwives of the economic transformation needed. The degree of artificiality we now have is wholly unsustainable and irresponsible.