Posted by Patrick Dunleavy.
Update on Poll Information and MPs projections for 11.00 on Monday 3 May
As the race enters its final stages, our new at-a-glance State of the Race gives you all the information you’ll need, all in one place. From now until Friday morning we will update these tables on a rolling basis so that they always reflects the five most recently published polls, and what the outcome means immediately in terms of the top three parties’ seats in the House of Commons.
Vote Shares
| Votes for the top three parties (and Others) | LSE % Vote Shares | Compare Sky News % Vote Shares |
|---|---|---|
| Conservatives | 34 | 35 |
| Labour | 28 | 28 |
| Liberal Democrats | 27 | 27 |
| Other Parties | 10 | 10 |
| Tory Lead over Labour | +6 | +7 |
Projected MPs
| Projected MPs | LSE seats projection | Compare BBC ‘polls of polls’ seats projection |
|---|---|---|
| Conservatives | 247 | 267 |
| Labour | 276 | 270 |
| Liberal Democrats | 94 | 84 |
| Other Parties | 14 | 11 |
| Northern Ireland | 18 | 18 |
| Labour lead over Tories | +29 | +3 |
| Labour short of working majority (326 seats) | -50 | -56 |
Technical note: Our poll tracking methodology is described here. For seats projections we use a uniform national swing from the 2005 adjusted results, with some small tweaks for tactical voting. The working majority level is 326 for Labour, but only 318 for the Conservatives, who can rely on Unionist MPs from Northern Ireland to support them.
Brief Commentary
Weekend polls suggested a strengthening Tory lead, but Monday polls suggest no trend, with UKIP and BNP support possibly increasing instead. Sunday polls had the Tories clearly the largest party in the Commons, but now Labour edges ahead in terms of MPs. The race is close fought and opinion is still fluid.
What this means in terms of seats
From the LSE projection, the new political map of the UK would look like this:From the LSE projection, the new political map of the UK would look like this:
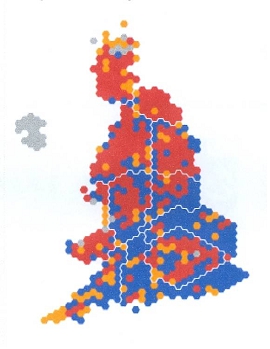
How does this map work? Each seat is one dot (irrespective of the size of the area). The white boundaries show the government standard regions.
Advance Notice: Stay with us on Election Night
We’ll be blogging all day and night through Thursday 6 May to 1.30am on Friday 7 May, with the latest updates from LSE’s all-night Election Event, which will also be Webcast live. Bookmark us for an impartial alternative view that cuts through the chatter to the significant developments.
If the seats and government outcome is still substantively unclear at 9.30 am on Friday 7 May, we will restart our coverage until the outcome is resolved.
Even more advance Notice: Post-election analysis and the transition to a new Government
From Friday 7 May this blog will be bringing you the most up-to-date and factually comprehensive analysis of how British voters decided, and what the UK’s voting system did with their preferences. LSE Experts from many disciplines will also be assessing what the election means
– for all the main parties
– for the political and constitutional development of the UK, and
– for the full range of public policies and UK economic development.


I should add, using a different way to measure the possible outcome of the election, I come up with much higher numbers for the LidDems and much lower for Labour
This is a link to the 65 Labour seats my analysis finds are likely to be won by the LibDems with a turn out of over 65%
http://bciconcoclast.blogspot.com/2010/04/63-seats-i-am-90-certain-will-be-lost.html
If you look more closely at the polls, you will see that they are getting in the range of 85% of the respondents saying they have a preference in the election. This is out of sync with the realistic turn out of 60-70%. It is important to consider who is likely to be voting and who is not.
In many election this discrepancy does not make much difference as the error is evenly spread, though I would argue that in 1997 it was Conservatives supporters that did not show up.
In this election I can see the supporters of Labour being most likely not to vote and a lot of people that had not been voting to come out and vote for the Liberal Democrats. This is likely to change the end result for the vote percentage for each party.
The pollsters are getting an accurate measure of public support of political parties, but it is not an accurate prediction of the vote on election day.
The one pollster that seems to asking the questions in such a way as to if people will vote or not is Angus Reid. They are finding the same 15% that are not voting, but they are finding another 35-40% that are not certain if they will vote or if they will change their vote In reading these tea leaves, the numbers look very good for the LibDems if the turn out is high, over 65%.
Angus Reid are also the only pollster getting Labour at below 25%, I see their differing methodology likely to be causing the difference and this could very well be a better measure of Labour support if their supporters are less likely to vote.
I think of this when I see certain polls in the media:
http://www.phdcomics.com/comics/archive.php?comicid=1271
Certainly not the LSE polls though 🙂