

 Few analyses of the election result have got beyond the headline outcome and started to unpick the detail. Ron Johnston, Charles Pattie and David Manley do this for the pattern of marginal seats before and after the contest and cone up with some highly significant findings.
The result of the 2015 general election in Great Britain can be summarised in four headlines:
- The SNP virtually wiped out its three opponents in Scotland;
- The Conservatives and Labour together removed the great majority of Liberal Democrat MPs in England and Wales;
- UKIP and the Greens both increased their vote shares threefold, with the former becoming the third largest UK party (in terms of votes but not seats); and
- There was very little other change: Labour gained 10 seats from the Conservatives in England and Wales, but lost eight giving a net shift of just two.
Beneath those headlines, however, a number of significant other changes occurred – barely noticed by the commentators at the time or since. One of these was the decline in the number of marginal constituencies – of potential crucial importance in the run-up to the 2020 contest: this outcome was very much a consequence of the first three headlines identified above.
Some graphs show the evidence. The first two show the number of constituencies according to their degree of marginality for each of the Conservative and Labour parties after the 2010 and 2015 elections. The constituencies are grouped into ten categories: the first five (on the left of each graph) contain the seats that the party lost at the relevant election according to the percentage difference between its share of the votes cast and that of the winner; the other five (on the right) contain those that the party won, according to the difference between its share of the votes cast and that of the second-placed party.
Figures 1 and 2: The distribution of constituencies according to their marginality for the Conservative and Labour parties after the 2010 and 2015 general elections
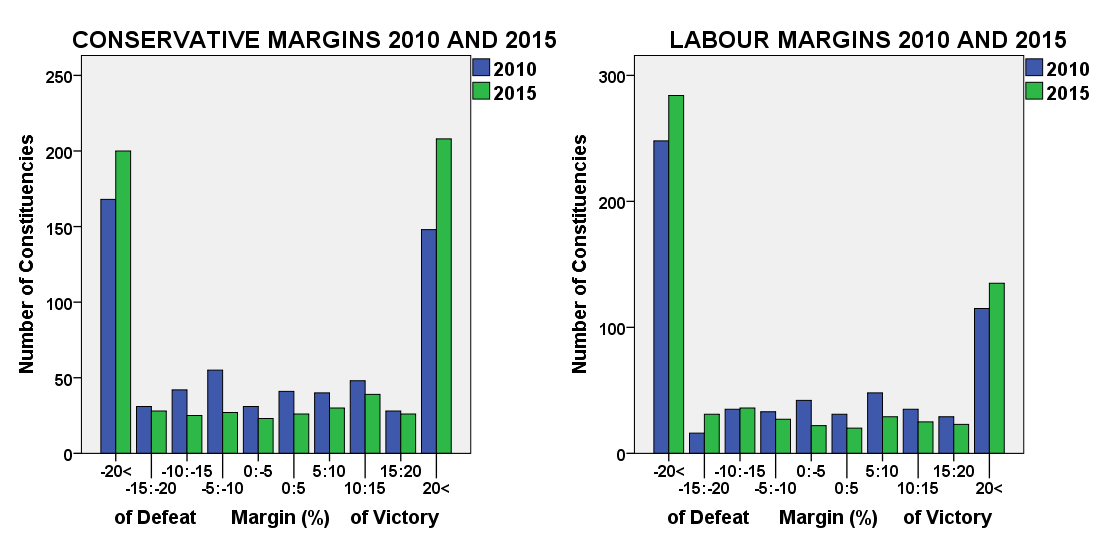
There is a common pattern to both figures: the number of constituencies at the two extremes has increased, whereas the centre it has declined. Thus Labour had 248 ‘hopeless’ seats after the 2010 contest (those which it lost by more than 20 percentage points and which it had virtually no hope of regaining at the next contest), but 284 after the 2015 election; the respective figures for the Conservatives were 168 and 200. At the other extreme, both parties increased their number of very safe seats (those they won by 20 percentage points or more and which they were very unlikely to lose next time): Labour’s number increased from 115 to 135; the Conservatives’ from 148 to 208.
This substantially increased polarisation of the voting pattern for each of the two largest parties was matched by a decline in the number of marginal contests – defined here as those which were either won or lost by a margin of less than 10 percentage points and could be targeted next time (and won/lost with a swing of no more than +/-5 per cent). After the 2010 election there were 75 seats in that group which Labour lost and a further 79 which it won – a total of 153 marginal seats to be defended/attacked. Five years later, that total had been reduced to 98 (a drop of over one-third): 49 were won by Labour in the 2015 contest and the other 49 lost. For the Conservatives there was a similar drop from 167 to 106 – of the latter, they won 56 in 2015 and lost 50.
Why this polarisation of the voting map, with the hollowing out of the marginal middle? Quite simply, because of the SNP surge, the LibDem collapse, and – to a lesser extent – UKIP’s growth. The next two figures illustrate this for one group of constituencies.
Figures 3 and 4: The average percentage share of the votes won by the five parties in 2010 and 2015 in constituencies, where the Conservatives and Liberal Democrats occupied first and second places after the 2010 election
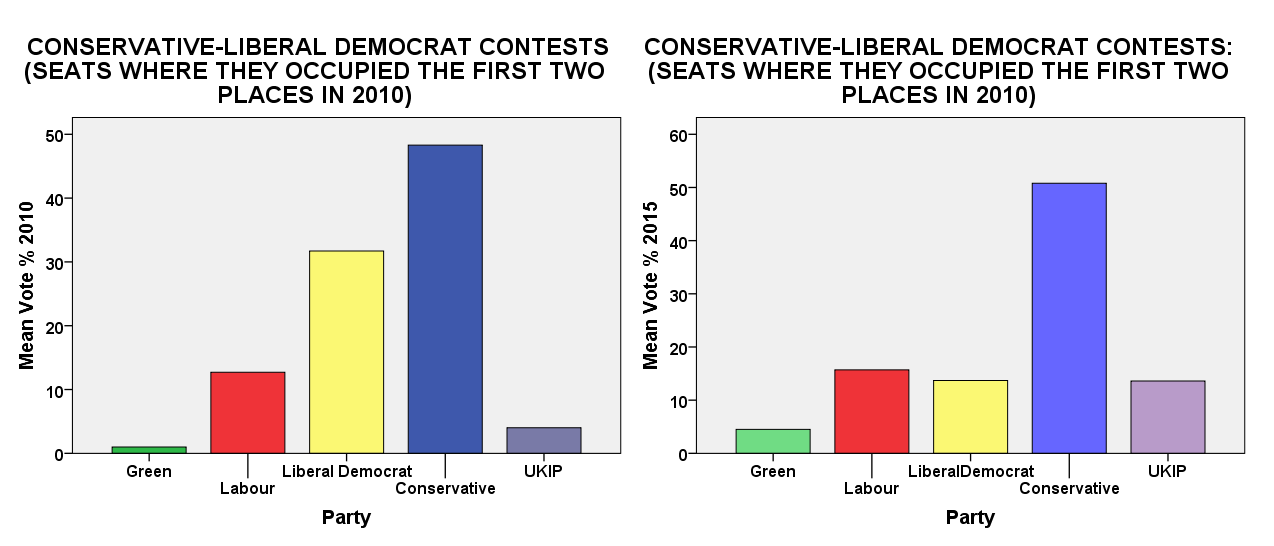
In 2010 there were 204 constituencies where the Conservatives and the Liberal Democrats occupied the first two places, getting on average around 50 and 30 per cent of the votes cast; Labour came a poor third, averaging just over 10 per cent of the votes. Five years later, the right-hand graph shows that the Conservative share of the vote in those 204 seats stayed about the same but the Liberal Democrat share halved: Labour’s average hardly changed and UKIP’s increased to about the same as those other two. In 2010 many of those seats were won by the Conservatives, in some with small majorities, and others by the LibDems – again by relatively small majorities in most cases. In 2015 virtually all of them were won by the Conservatives, by large majorities. The marginal seats largely vanished and the Conservatives won many more safe seats, with Labour or UKIP as likely to be in a poor second place as the LibDems.
A very similar pattern occurred in the 95 seats where Labour and the Liberal Democrats occupied the first two places in 2010. The Labour average share increased by some six percentage points on average in those seats in 2015, while the LibDem share fell by about 2/3rds, the Tory share hardly changed and UKIP won on average as many votes as the LibDems. The overall result – many more substantial victories for Labour: more safe seats and fewer marginals. And in Scotland, of course, many former marginals became hopeless seats for Labour after the 2015 rout.
At the 2015 election, if Labour had won all of the 75 marginals where it lost by less than ten percentage points in 2010 and held on to the 79 that it won narrowly then, it would probably have won a majority and Ed Miliband would have been Prime Minister. But if in 2020 Labour wins all the 49 marginals where it lost in 2015, and holds on to the 49 it won it would probably still not be the largest party – and David Cameron’s successor would return to 10 Downing Street. The vanishing marginals have made a 2020 Labour victory much harder to achieve.
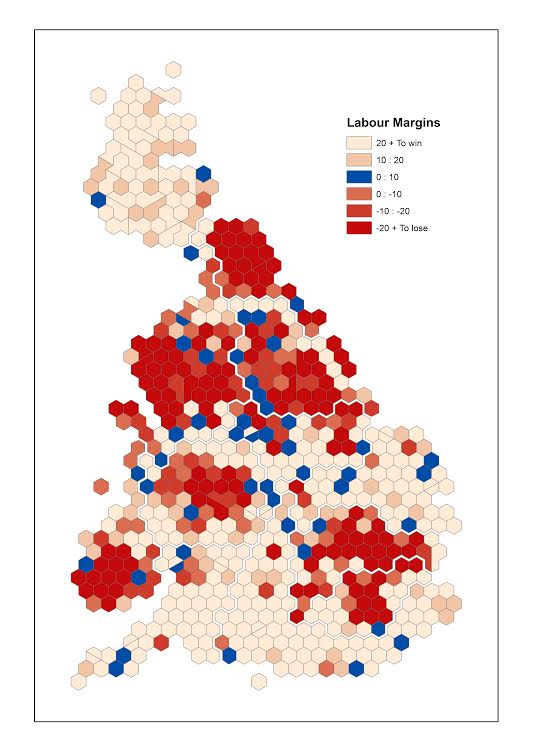
And where are those that are left? The cartogram shows the margin by which Labour either won or lost in 2015 in all British constituencies. Those in deepest red – its safe seats – are concentrated in London, South Wales, the West Midlands, the Northwest and Northeast, and Yorkshire/Humberside, whereas most of southern England and Scotland is a sea of constituencies where it needs to increase its vote share by 20 percentage points or more in order to win in 2020. Of the 49 seats where it is ten points or less behind (shown in blue), almost half (24) are concentrated in three regions: the East Midlands, the Northwest and Yorkshire/Humberside. To win seats in the first of those regions it needs to attract more support from those who have prospered from the recent economic recovery; in the other two, it needs to win back support from the disenchanted working-class who voted UKIP in 2015.
The margin of victory-defeat for Labour at the 2015 general election
Of course, that assumes that the fight focuses entirely on those marginals – that the SNP vote doesn’t collapse and/or the LibDems don’t enjoy a remarkable recovery only five years after their slaughter, or/and UKIP’s vote share doesn’t grow substantially again. 2015 showed that major changes in the smaller parties’ vote shares, and very small changes in those of the two largest, can have very substantial impacts not just on the outcome of that contest but also on the prospects for the next. That could happen again – but it may not, and in England and Wales this means we are back close to the pre-1970 two-party (Lab-Con) politics across much of the country.
BUT – and it is quite a big but – we won’t be using those constituencies in 2020. A Boundary Review is scheduled to start in 2016 and the Conservatives have indicated that they will not halt it – although they will change one aspect: the number of seats will be retained at 650 and not reduced to 600. (They think that by not changing the number the disruption to the existing seats will be less: it won’t – our research on this showed that substantial disruption would occur because of the requirement that all constituencies have electorates within +/-5 per cent of the national average, whatever the number of constituencies).
So the constituencies will be different in 2020 from the current 650 – in many places, very different. But they will be laid down on the current maps of support for the parties and though the local detail will change our research suggests that the general picture will not. The 2015 pattern of voting across Great Britain means that Labour’s task in 2020 is not only harder than it was in 2015, it is probably even harder than they currently realise!
Note: This article gives the views of the authors, and not the position of the British Politics and Policy blog, nor of the London School of Economics. Please read our comments policy before posting.
Ron Johnston is a Professor in the School of Geographical Sciences at the University of Bristol.
Charles Pattie is a Professor in the Department of Geography at the University of Sheffield.
David Manley is a Lecturer in the School of Geographical Sciences at the University of Bristol.


But do your calculations not also show that if the LDs advanced a lot, it would mainly be at Tories’ expense, and thus boost the number of marginals which Labour might just win?