
 A substantial body of research shows that British political parties benefit electorally from their constituency campaigns, especially where they are the local challenger in a seat. But, Ron Johnston, Charles Pattie and Todd Hartman explain, the marginal returns parties get on their local campaigns are not the same everywhere. Parties get more electoral bang for their campaign buck in the seats that matter most in any election, the marginals.
Although they were once thought of as a side-show to the main event of the national General Election campaign, local contests in each of Britain’s parliamentary constituencies are now seen as an important part of parties’ election strategies. A substantial body of research, conducted over many years, has consistently shown that the harder parties campaign in a seat, the better their reward in terms of their vote share, and the worse their local rivals do. Recognising this, central party organisations focus their local campaign efforts on particular seats for maximum electoral impact, and local parties there raise more money and put more canvassers out than do their contemporaries in safer seats. Not surprisingly, under the first-past-the-post rules used for elections to Westminster, that means the marginal constituencies, where relatively small movements of votes can make the difference between winning and losing the seat, are the focus of the campaigns; if you live elsewhere, local inactivity would suggest there is no election even being held.
We know, too, that constituency campaigning tends to pay greater dividends where a party is the main challenger in a seat than where it is the incumbent defending a seat. Beyond that, however, most previous research on local campaigning has paid surprisingly little attention to whether the effectiveness of campaigns varies from seat to seat. Most studies assume that (once we take into account whether a party is defending a seat) the marginal impact of its constituency campaigning is the same everywhere: increase campaign intensity by the same amount – how much you spend on leaflets and posters, how many emails and tweets you send to potential supporters, how many voters are contacted on the doorsteps, and how many party bigwigs visit the seat – and on average gain the same electoral effect as others in one’s party, no matter what the local conditions. What matters, in this view, is how much resource a party is able or willing to put into a local battle: the greater the resource the greater the rewards. But the pay-off for each extra ‘unit’ of campaign resource expended is assumed to be the same everywhere.
Our work suggests that assumption is quite misleading. To see why, let’s begin by looking at where the main parties put their local campaign resources. We have looked at Conservative, Labour and Liberal Democrats’ constituency campaigning in every UK general election from 1997 to 2017. Electoral law requires all candidates to declare how much they spent on their campaign during the four weeks or so of the official election campaign, and we use that amount (expressed as a percentage of the legal maximum expenditure allowed in each seat) as a measure of campaign intensity.
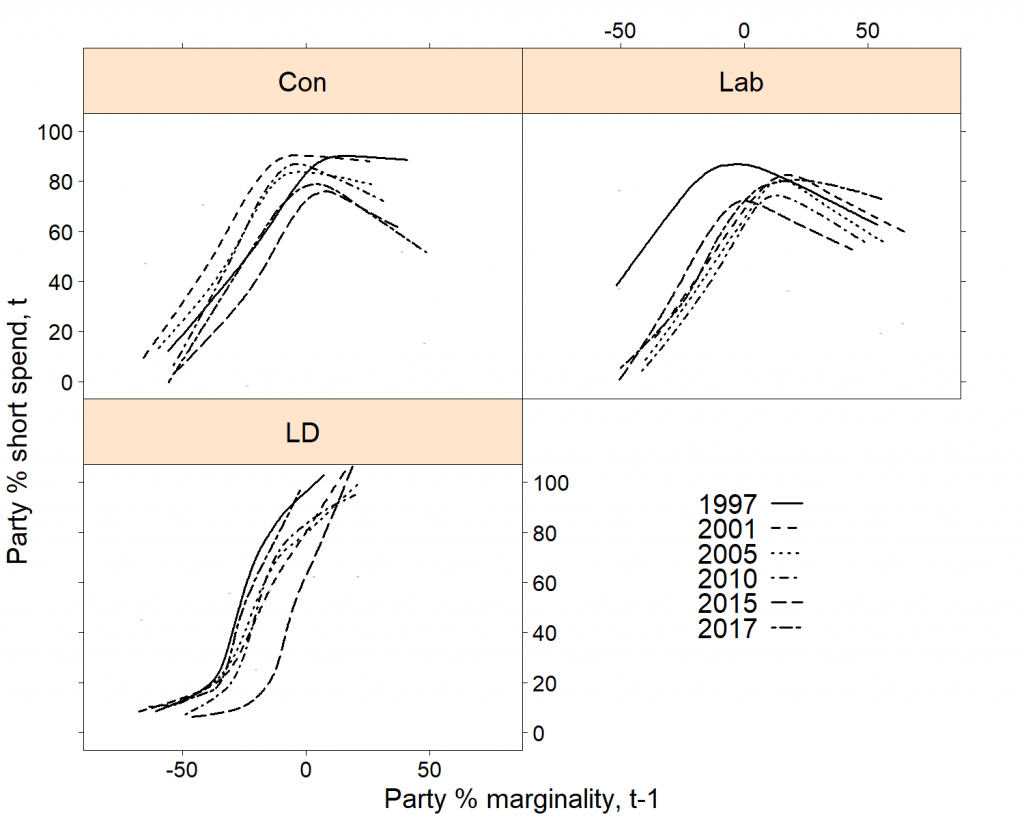
To get a sense of where the parties focus their campaign efforts, the following graphs plot campaign spending at each election for each party (on the vertical axes) as a function of seat marginality at the previous contest (on the horizontal axes). Marginality is measured as the difference between a party’s local vote share at the previous election and, where it won the seat then, the party in second place or, where it lost, the winning party. It is positive where a party was defending a seat, and negative where it was the challenger. The closer the marginality score is to zero, the more marginal (and hence competitive) the seat: the more secure a party is in a seat, meanwhile, the more positive its marginality score, and the more hopeless the seat is for the party (i.e. the further behind the local winner it was), the more negative the score. In the graphs, we show the smoothed average trend lines for campaign spending in each year.
Figure 1
In all election years, all three parties spent least, on average, in the seats where they began the campaign furthest behind the previous winner (to the left of each graph), and most in more marginal seats, towards the centre of the graph. And both Labour and the Conservatives spent less, on average, in seats they were defending by large margins, to the right of each graph (though this is not so evident for the Liberal Democrats, who were defending fewer seats overall, and had relatively few very safe seats).
This makes good rational sense from the parties’ point of view: most resources are raised locally in those seats most likely to change hands – few local parties get financial support from their central and regional bodies, so they and their candidates must raise, through donations and various fund-raising activities, what they want to spend. (This also explains why readers living in safe seats will tend to encounter so little election activity in their areas compared to readers in more competitive locations.)
As a consequence, the total effect of a party’s constituency campaigning on its vote share tends to be larger in its more marginal seats than in its less marginal ones, simply because it engages in more campaign activity in the former than in the latter.
But that, it turns out, is not the whole story. To see why, consider the following graphs, which are derived from statistical models analysing each party’s constituency vote share in each election between 1997 and 2017 as a function of four things: the marginality of the seat for the party at the previous contest, the party’s campaign expenditure in each seat at each election, the interaction between marginality and campaign spending which tells us whether the effect of campaign effort varies by the competitiveness of an election, and whether the party was the challenger or the incumbent in a seat at a given election.
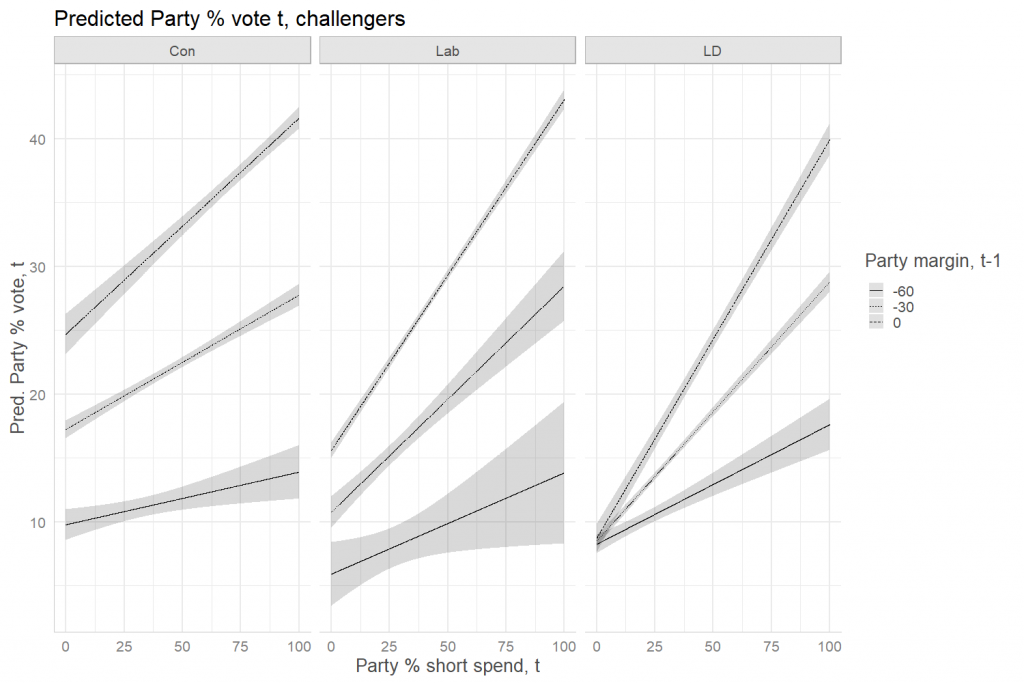
Figure 2: The effect of increasing campaign spending on vote share where the party is a challenger.
The first set of graphs shows the effect of increasing campaign spending on each party’s vote share in all seats where the party was a challenger. We have used the models to calculate average vote shares in three different types of marginal seat: seats where the party was 60 percentage points behind the winner at the previous election (the lower line in each graph: though relatively rare for our three parties, there are a number of seats where parties are this far behind the party defending the seat), seats where it was 30 points behind (the middle line), and seats where it was in effect tied with the winning party (the top line in each graph).
Not surprisingly, at any given level of campaign spending all three parties were predicted to do better in seats where they started the campaign more closely in contention with the incumbent than in seats where they were further behind. Nor is it much of a shock to see that (no matter how marginal the constituency), the predicted relationship between spending and vote share for each challenger party was positive: the more the local party spent, the better it did. But more striking is that the lines in each graph vary markedly in steepness (an indicator of varying returns to campaign effort). In all three cases, the steepest line is that for the most marginal races, and the shallowest is that for the least marginal. And the differences in steepness are statistically significant. In other words, the marginal return to campaigning for challenger candidates was greater in closer races than it was in races where they were campaigning from further behind the leader.
So the tendency for parties to enjoy better results in marginal seats where they are challengers than in seats where they are well behind the incumbent is not just because parties push more resources into the former contests than into the latter (though this is important), but also because each ‘unit’ of campaigning resource has a bigger effect in the former than in the latter. If two branches of a party fought equally intensive local campaigns, but one was doing so in a seat where it lost the previous election badly, whereas the other was fighting in a seat where it lost only narrowly last time, the latter party would, on average, get a larger ‘boost’ from its campaign than the former.
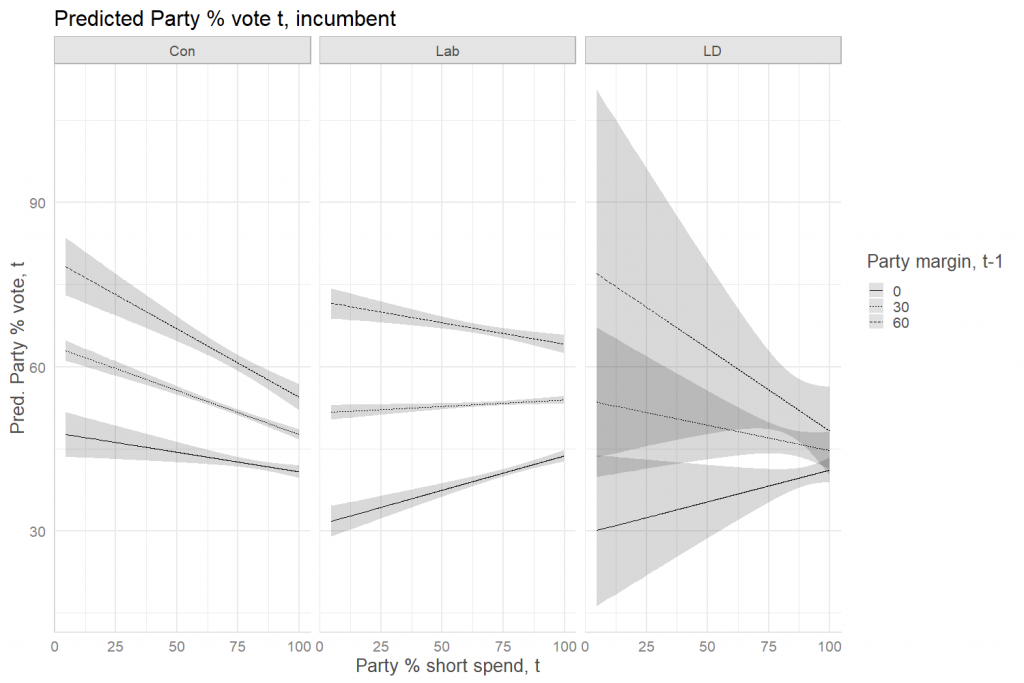
But what effect do parties’ campaigns have in seats they are defending? Does something similar happen there? The answer is yes – but with a twist! Our final set of graphs repeat the previous set, but this time for seats defended by each party in at least one of the elections we examined. This time, we have used our models to estimate the average effect of increasing campaign spending on vote share for seats where a party won the previous election by increasing margins over its nearest local rival: by an ultra-narrow margin (the bottom line in each graph); a margin of 30 percentage points (the middle line); and super-safe seats won last time by a margin of 60 percentage points (again, while few seats were defended with such large margins, there were some).
Figure 3: The effect of increasing campaign spending on vote share where the party is an incumbent.
On average, both Labour and Liberal Democrat candidates defending seats their party won by very narrow margins in the previous election did better the harder they campaigned (the relevant slopes in their graphs are positive – though the very wide confidence intervals in the Liberal Democrat graph suggests the effects are not really significant for that party’s incumbents). But as the incumbent parties’ previous winning margins increased, the positive effects of increasing campaign spending declined, or even went into reverse, as indicated by the shift from positive to negative slopes. In safer seats, the harder a party campaigned, the worse it did – and the safer the seat, the worse the marginal downturn (for the Conservatives, this was true even where the party was defending ultra-narrow majorities too).
The reason is simple. Most seats where a party previously won by a large margin are ultra-safe for that party. There is therefore little incentive for incumbents there to campaign hard… unless they face an unexpectedly determined and effective challenger. In other words, more spending by incumbents in ostensibly very safe seats is really a sign of weakness, not of strength. They spend more on their campaigns because they are losing ground to rivals and need to do something to try and regain it, not because they want to boost their majorities further.
Researchers (and candidates) have known for many years that local campaigning has an effect on parties’ electoral fortunes, and that the effect is different for incumbents and for challengers: for the latter, more campaigning boosts vote shares, while for the former, more campaigning can be a sign of weakness and is often associated with either unchanging support or even declining support. But our results reveal, we suspect for the first time, that the closeness of the competition matters, too. The safer the seat for an incumbent, the less likely they are to benefit from increasing their local campaign activity (and, as we have seen, in safer seats, campaigning more actively is associated with a worsening return in terms of vote share). But for challengers, campaigning is generally beneficial – and it is most beneficial in the closest races. By and large, challengers don’t just expend more campaign resources where they most need to, in the most marginal races, but they get more bang for each campaign buck there too.
__________________________________
The above draws on the authors’ published work in Political Geography and the Journal of Elections, Public Opinion and Parties.
 Ron Johnston is Professor in the School of Geographical Sciences at the University of Bristol.
 Charles Pattie is Professor in the Department of Politics at the University of Sheffield.
 Todd Hartman is Senior Lecturer in the Sheffield Methods Institute at the University of Sheffield.


