

 Some commentators have argued that the prosperity boom experienced under the last Labour government was a ‘free ride’ which benefited from the earlier policies of Margaret Thatcher and the Conservatives, and that Labour did little to improve the economy, leaving it in a more vulnerable state when the global recession came. New research from Anna Valero, John Van Reenen and Dan Corry takes an in-depth look at the UK’s GDP and productivity growth between 1997 and 2010, and finds that many of Labour’s policies were beneficial for economic growth, and that this growth was not all an unsustainable ‘bubble’, but was based on some real productivity increases fed by growth in new skills and technology. However, in some areas, such financial regulation Labour’s policies clearly failed. Using this evidence, the authors recommend the chancellor slows fiscal consolidation, and more importantly, develops an explicit growth strategy around human capital, infrastructure and innovation.
A common view is that the performance of the UK economy between 1997 and 2010 under Labour was very weak and that the current economic problems are a consequence of poor policies in this period. In our report out today, we analyse the historical performance of the UK economy since 1997 compared with other major advanced economies and with performance prior to 1997, notably the years of Conservative government, 1979-97. Focusing on measures of business performance, especially productivity growth, we found that relative to other major industrialised countries, the UK’s performance was good after 1997. Productivity is a key economic indicator as in the long run, productivity determines material wellbeing – wages and consumption.
The big picture – strong GDP per capita growth after 1997
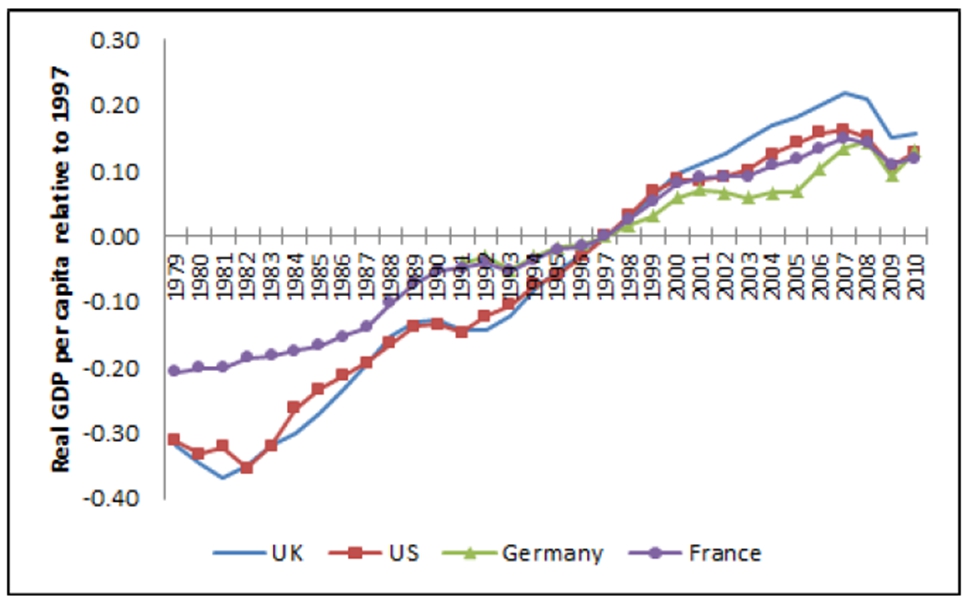
The UK’s growth of GDP per capita – 1.42% a year between 1997 and 2010 – was better than in any of the other “G6” countries: Germany (1.26%), the US (1.22%), France (1.04%), Japan (0.52%) and Italy (0.22%). Figure 1 shows GDP per capita (now defined as “adults” to control for demographic shifts) in four countries relative to 1997. The height of the line indicates the cumulative growth: in 2010, the UK had a level of GDP per capita 17% higher than in 1997; over the same period US GDP per capita had grown by 14%.
The slope of the line gives us the growth rate. We can see that the UK had the steepest line, or fastest growth rate, in the post 1997 period; and also in the pre-1997 period (when it tracked the US).
Figure 1 – Trends in GDP per capita (adult) 1979-2010 (relative to 1997)
The UK‟s high GDP per capita growth was driven by strong growth in productivity (GDP per hour), which was second only to the US, and good performance in the jobs market (which was better than in the US). The UK‟s relative economic performance appears even stronger in the years prior to 2008 before the Great Recession engulfed the developed world.
But wasn’t it all a bubble?
The UK’s strong productivity performance relative to other countries was a continuation of the trends during the period of Conservative government from 1979. This broke a pattern of relative economic decline stretching back a century or more. UK GDP per person fell relative to the US, Germany and France from 1870 to 1979, but over the next three decades this trend reversed. UK GDP per capita was about 23% above the US in 1870 whereas the US was 43% ahead of the UK by 1979. By 2007, the UK still lagged behind the US, but the gap had closed to 33%. During the past 30 years, the UK has had a faster catch-up of GDP per capita with the US under Labour than under the Conservatives, although there was a slower rate of relative improvement over France.
But was the growth in productivity due to “unsustainable bubbles” in sectors such as finance, property, oil and the public sector? The answer is “no”. The expansion of property and the public sector both actually held back measured aggregate productivity. The financial sector contributed only about 0.4% of the 2.8% annual growth in the UK market economy between 1997 and 2007. Our analysis shows that the biggest contributors to productivity increases were the business services and distribution sectors, and they were generated through the increased importance of skills and new technologies. It is difficult to see why all such activities could be generated by an artificial financial or property bubble.
Figure 2: Sector contributions to market economy productivity growth

Analysis of other indicators of business performance, such as foreign direct investment, innovation, entrepreneurship and skills, supports our view that the gains in productivity were largely real rather than a statistical artefact. This evidence points to a more positive reading of the supply side of the economy than the current consensus. Although the UK still has some long-standing issues in terms of lower investment relative to other G6 economies (especially in R&D and vocational skills), things have improved.
Did Labour’s policies have any positive influence?
Some have argued that Labour simply enjoyed a “free ride” on the radicalism of Mrs Thatcher. Most analysis suggests that freeing up the labour market through breaking union militancy, removing subsidies for “lame ducks” and implementing privatisation, lower marginal tax rates and cuts in benefits all boosted productivity performance after 1979. On this line of argument the best that could be said is that at least Labour did not return to the failed pro-union, anti-competitive policies of the 1970s.
The “at least Labour didn’t mess it up” argument is not the full story. It is hard to believe that the reforms in the conservative years permanently kept productivity growth higher for the next 15 years. The anti-union policies may have raised output, for example, but it stretches credulity to think they kept the UK on a permanently better productivity growth path.
We argue that it is more likely that some policies of the Labour government drove some of the productivity improvement. In particular, the strengthening of competition policy, the support for innovation, the expansion of university education and better regulation in telecoms and elsewhere played a positive role. It is possible that immigration may have also have been a big plus. But establishing the magnitude of the causal impact of these policies is extremely difficult, and the need for proper quantitative policy evaluation remains as strong as ever.
The policy area where Labour clearly failed was in financial regulation. In addition, and more clearly with hindsight, public debt was allowed to rise higher than it should have. Although these factors did not fundamentally drive the boom and did not cause the global recession by themselves, the UK economy was more vulnerable to the recession than it should have been.
Does the Great Recession change everything?
Does the experience of the recession since 2008 show that the productivity improvements to the supply side since 1997 were illusory? We have argued “no” as the bulk of the 1997-2010 improvements were real and not due to the bubble sectors of finance, property and oil.
But how much did the financial crisis permanently reduce the rate and level of productivity growth? The extreme version of the “supply-side pessimism” argument is that because the recession was caused by a banking crisis, the fall in potential output has been severe and permanent, the UK’s output gap (the difference between actual and potential GDP) is now close to zero with productivity growth permanently lower for the foreseeable future. Pessimists point to the 7% fall in GDP and slower growth from the trough of the 2009 recession.
It is likely that the recession has caused some permanent fall in output compared with what it would have been without such a deep downturn. But we think there is huge uncertainty over the size of the output gap, as you can see in Figure 2. An alternative explanation to a simple supply shock that had permanently reduced the level and growth rate of potential output is that global demand is muted. Several elements point in this more optimistic direction. First, the pre-2008 productivity growth rate suggests that the supply side made real improvements before the crisis. Second, the fall in productivity 2008-11 is broad based and not all due to specific sectors such as finance and oil (just as the 1997-2008 productivity growth rates were not dominated by these sectors). Third, we look at the evidence put forward by the pessimists on inflation, jobs, capacity utilisation surveys and trade performance, and argue that none of these make a compelling case that the output gap is tiny.
Figure 3: Extreme optimists and pessimists’ views potential output and the output gap

We worry that policies based on an excessively pessimistic view of potential output can lead to needlessly slow economic growth. Indeed, the pessimism over the state of the supply side can become self-fulfilling as ever-larger austerity programmes cause excess scrapping of human and physical capital.
Policies in the short to medium run: to Plan B or not to Plan B?
The current “Plan A” for the UK economy is a period of very strong fiscal consolidation – spending cuts and tax rises to eliminate the structural public sector deficit in the life of this Parliament. An alternative Plan B would be to slow down the pace of the fiscal consolidation. If the output gap was near zero, then a Plan B would simply increase inflation, so the fact that we think there is a good chance of a substantial output gap implies the possibility of a Plan B. The desirability of a Plan B would be muted if monetary policy was sufficient, if fiscal policy was ineffective in an open economy like the UK, if any increase in public spending or tax cuts was irreversible or if markets would panic at any retreat from Plan A.
We consider these problems, but do not find them overwhelming objections. We argue that we do indeed need a medium-term plan for debt reduction but this does not have to be done at the current speed when the world economy is so fragile. This is also true for Northern Eurozone countries and the US. Thus we need a short-term stimulus (“Plan B”) and a long-term growth strategy (“Plan V”).
A strategy for long-run growth
A problem with the obsession over fiscal consolidation is that insufficient attention has been given to the problem of longer-term growth. The structural improvement in the UK’s relative performance since 1979 contained the lesson that getting the market environment right is key: strong product market competition, openness to foreign investment, flexible labour markets, a robust welfare to work system and smart regulation are major factors in promoting growth. Government has a role in all of this, setting the rules, and it also needs to be pro-active in building human capital and infrastructure and supporting innovation.
A growth strategy must go beyond the “laundry list” approach (even if such a list is useful) as policies interact with each other and policy efforts must be tightly focused. We sketch a plan for a “V-shaped” recovery that requires the state and civil society to scan the global economy for potential growth in demand, and then hone in on areas where the UK has actual or latent comparative advantage. Within this space there has to be relentless scrutiny of where the state is hindering and where it could help. A specific example is higher education where foreign students are an export industry of global growth and where the UK has very successful elite science. Restricting high skilled immigration is hugely damaging to this sector. More generally, growth policies could include supporting sector-specific skills, access to credit for small enterprises and subsidising innovation in key industries like green technologies, software and healthcare. We offer less of a blueprint for growth than a way of thinking about growth that could form the basis for economic revival.
Please read our comments policy before posting.
The LSE’s Centre for Economic Performance launched the report: UK Economic Performance since 1997: How bad was Labour? And what are the implications for restoring growth? at the LSE on 15 November at an event Chaired by the BBC’s Evan Davis. The Twitter hashtag for the event was, #CEPreport. Slides from the presentation are available now.


Low interest rates, simple.
The bubble was created in several sectors, but not confined to them as these had knock-on effects to other areas (a rising tide raises all boats). Also, the supply-side myth that the state can manipulate interest rates to generate positive outcomes is largely to blame for the bubble in the entire economy, people were borrowing at unrealistic rates and spending. What happened to the LSE of Hayek…?