João Paulo Pessoa and John van Reenen discuss new research into the apparently loose relationship between wage growth and productivity growth in the UK and the US. They find that workers as a whole are not missing out, but increasing non-wage costs and rising wage inequalities have restricted gains.
It is widely believed that American workers are being screwed (to use a technical economic term) by the firms they work for. Exhibit 1 in the case for the prosecution is that real wages of the typical US worker have hardly increased in four decades whereas labour productivity has continued to grow steadily. In other words, the pie is growing, but capital and the very richest workers (the fabled 1 per cent of the Occupy Movement) have eaten up all the economic goodies. Recently, it has also been suggested that the UK is starting to follow the same unhappy path with productivity growth outpacing wages.
Is this true? Well not really.
Have wages decoupled from productivity in the US and the UK?
The ugly label for the phenomenon of wage growth falling behind productivity growth is “decoupling”. Basic economics teaches that workers real compensation should grow in line with per capita GDP over the long-run. But between 1972 and 2010 American productivity grew by 84 per cent whereas median wages grew by 8 per cent. We call this by the even uglier term “gross decoupling”. Bear with us; you will see why we call it that. In the UK, things were also bad, but not quite so awful – the same measure of real productivity grew by 114 per cent and median real wages by 72 per cent. So gross decoupling was a whopping 76 percentage points in the US (84 per cent minus 8 per cent) and a substantial 42 percentage points (114 per cent minus 72 per cent) in the UK.
Is this slam-dunk proof that the Occupy protestors are right and economists, as usual, wrong? Are workers are being denied their fair share of economic growth?
Not so fast. What Economics 101 focuses on is “net decoupling” which is the idea that average compensation should roughly follow GDP per hour deflated in the same way. In the UK net decoupling is basically zero: both wages and productivity rose by the same amount since 1972. In the US, there is a bit of net decoupling: about 13 per cent.
So what explains this massive difference between gross and net decoupling? In the UK, it is basically two things: inequality and non-wage labour costs. First, the UK has had growing wage inequality since 1979 and this means that average wages have risen much faster than median wages (which is the wage that separates the population in two halves, 50 per cent earning more than the median earner and 50 per cent earning less). Secondly, non-wage labour costs such as pensions and healthcare benefits have risen very quickly. These are all part of what is called “compensation”, which is what employers care about, not just the direct cost of paying salaries.
The US has experienced even larger increases in inequality and non-wage labour costs than the UK, and these two account for about half of the gross decoupling between productivity and wages in the US. But in addition there is a growing divergence between the GDP deflator and the consumer price deflator with the GDP price deflator rising much more slowly than measured consumer prices. This isn’t true in Britain where both measures of inflation track each other quite closely. No one has quite figured out why this is, but it is probably related to the fact that the price of information and communication technology (ICT) related investment goods (servers, networks, enterprise software and the like) have fallen faster than measured consumer price of ICT goods. Improved measurement of consumer prices tends to bring the two deflators more into line – some consumer price measures reduce the deflator contributor of decoupling from 30 per cent to only 6 per cent and so substantially reduce the degree of gross decoupling in the US.
Breaking it all down
All this can be seen in Figure 1 below which is for the UK between 1972 and 2010. “Gross decoupling” was 42 per cent but net decoupling (the blue bar) was -0.8 per cent. The white bar is the contribution of wage inequality (a 15 per cent contribution) and the horizontally hatched bar are “benefits” (a 17.5 per cent contribution), the difference between wages and compensation. This explains almost all of the divergence between gross and net decoupling.
Figure 1: What explains Gross Decoupling (the difference between GDP per hour deflated by GDP deflator and median wages deflated by CPI)
Decomposition in the UK, 1972-2010
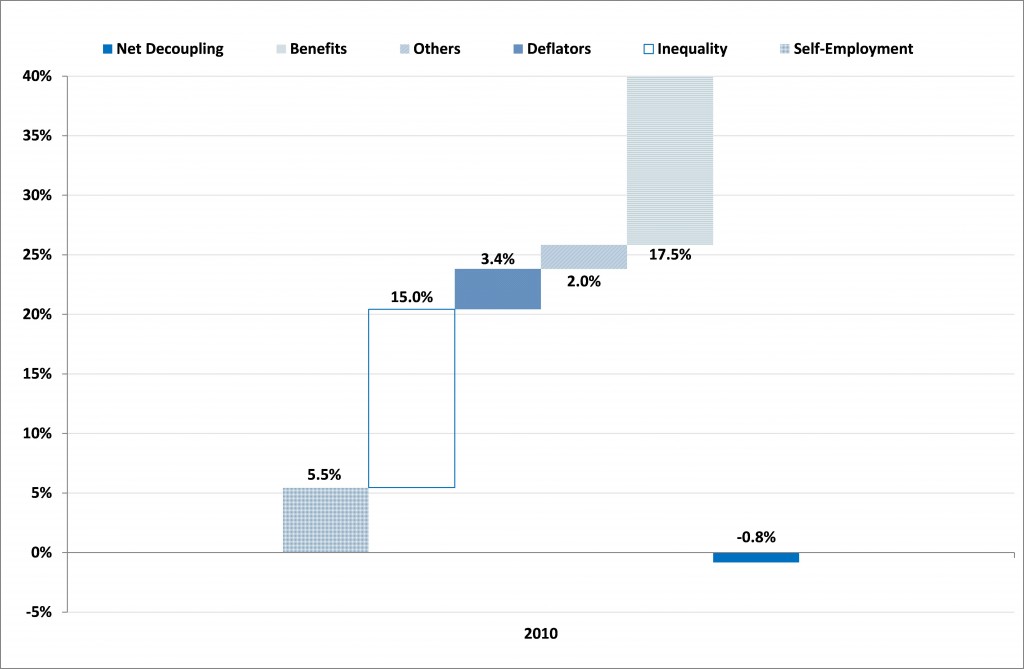
Notes: Each bar is the contribution of the different elements accounting for gross decoupling in the UK (the fast that GDP per hour deflated by the GDP deflator grew by 42% more than the growth of median wages deflated by the CPI.
Source: “Decoupling of Wage Growth and Productivity Growth? Myth and Reality” by João Paulo Pessoa and John Van Reenen, Centre for Economic Performance
Another check on this is to look at the labour share of national income. Labour’s share has basically been constant in the UK which is consistent with our analysis (see Figure 2). If average compensation had really grown much more slowly than productivity, the share of profits in GDP would have risen a lot and the share of labour would have fallen. Although there is variation over the business cycle, it the share of income going to the working class is basically the same now as it was 40 years ago. Interestingly, there is more of a fall in the labour share of income in Continental EU nations and Japan, so there might be evidence of capitalists doing a lot better than workers in these nations whereas workers have done relatively better in the US and UK!
Figure 2: The share of Labour Costs in total GDP, 1972-2020 in the UK
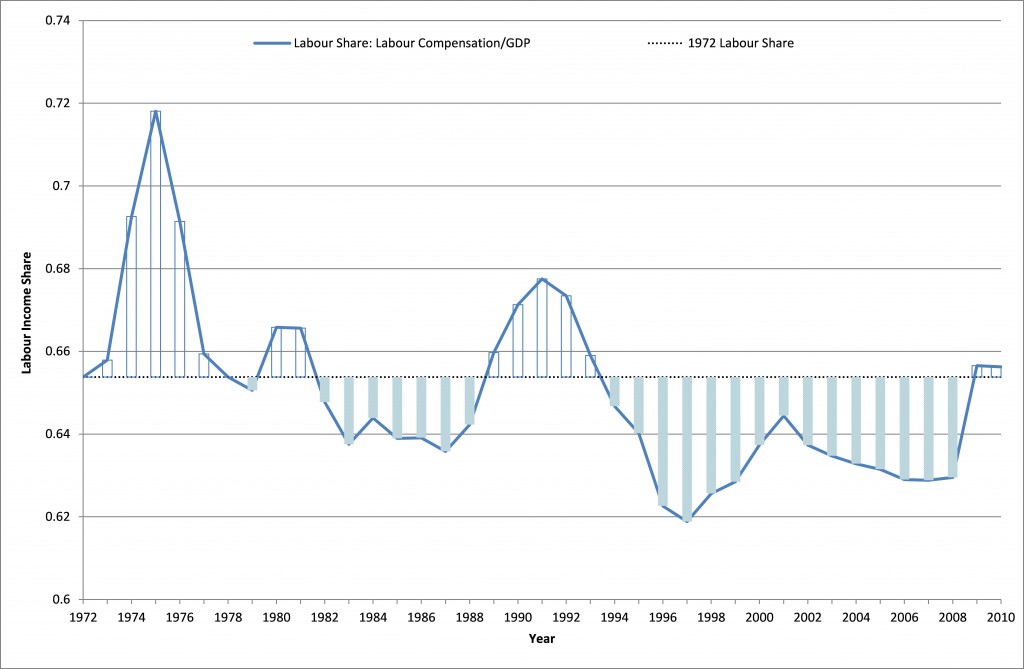
Notes: This is the share of labour costs in GDP.
Source: OECD
Policy Implications
In terms of policy, the decoupling debate has shed more heat than light. Our results suggest that net decoupling is essentially a myth and cannot be used to justify redressing the overall balance between wages and profits. The real problem is inequality among employees – wage inequality has risen massively since the late 1970s and this is a real problem. In the US the share of income of the top 1% was higher than it had been for a century, about the same as 1928 just prior to the Wall Street crash that ushered in the Great Depression and World War II. But understanding the causes of wage inequality is exactly where economics has focused on over the last 20 years (see, for example, John Van Reenen (2011) “Wage, Inequality, Technology and Trade: 21st Century”). Fundamentally, rapid technological change and the integration of low wage economies like China and India into the global economy has massively increased the relative demand for more skilled workers. Improving the quantity and quality of skills for people in the bottom half of the education distribution must be the main priority for policy makers in the UK and US. This will boost productivity and real wages.
For further details of this article see “Decoupling of Wage Growth and Productivity Growth? Myth and Reality” by João Paulo Pessoa and John Van Reenen, Centre for Economic Performance
Please read our comments policy before posting.


For 12 years it’s been above and 26 years below; updating recent falls in living standards would show another dip, that being the norm. The area below looks bigger than that above, too.
“Fundamentally, rapid technological change and the integration of low wage economies like China and India into the global economy has massively increased the relative demand for more skilled workers.”
This is part of the explanation for why inequality has increased in the US, but you cannot overlook the political component. Many of the US’s “free” trade agreements weren’t free at all. Policymakers deliberately exposed lower-skilled (particularly manufacturing) workers to direct competiton from overseas, while at the same time preserving labor market protection for higher-skilled, white-collar workers, such as doctors, lawyers, and investment bankers. It is very difficult, if not impossible, for a doctor in the developing world to train up to US medical standards and to practice medicine in the US. This artificially constrains the supply of doctors in the US, which artificially boosts their wages.
In addition, the presence of free too-big-to-fail banking insurance for US banks has helped to worsen inequality. Rent seeking activites, as opposed to useful financial intermediation, has caused wages in the securities industry to explode relative to those in all other industries across the economy. The downside (low job security) never manifested itself, because all of the banks knew that they would get bailed out by the government when things went sour. So we still have the same bankers and economists who missed the $8 trillion residential real estate bubble employed, earning seven-figure paychecks. If the US hadn’t let too-big-to-fail banking flourish, then all of these “experts” would be unemployed right now. If this were the case, then inequality would probably be much lower right now.
There are many other political issues that have led to growing inequality in the US, such as overly generous copyright and patent protection for huge multinational corporations and the Treasury’s strong dollar policy in the late-1990s.
So you’ve got half the story. Education matters. But politics matter too.