 How well do citizens understand the associations between social groups and political divisions in their societies? Noam Titelman and Ben Lauderdale report results from two experiments where subjects were provided with randomly selected demographic profiles of voters and were asked to assess either which party that individual was likely to have voted for in the 2017 election or whether they were likely to have voted Leave or Remain in the 2016 referendum. They find that, despite substantial overconfidence in individual responses, on average citizens’ guesses broadly reflect the actual distribution of groups supporting the parties and referendum positions.
Since the EU referendum, commentary and debate has often caricatured the demographic patterns in how UK citizens voted on Brexit: the working class voted for Leave, the middle class for Remain; Scots voted for Remain, English Northerners for Leave; the young voted for Remain and the elderly for Leave.
Public discussions of voter behaviour sometimes suggest that social groupings align much more strongly and unambiguously with voter behaviour than is actually the case. First, people are simultaneously members of several different groups. Second, although there are correlations between demographic characteristics and vote choice, very few areas or groups voted all that decisively for one side or the other. Knowing someone’s demographics might enable a probabilistic guess about how they voted, but not a deterministic one.
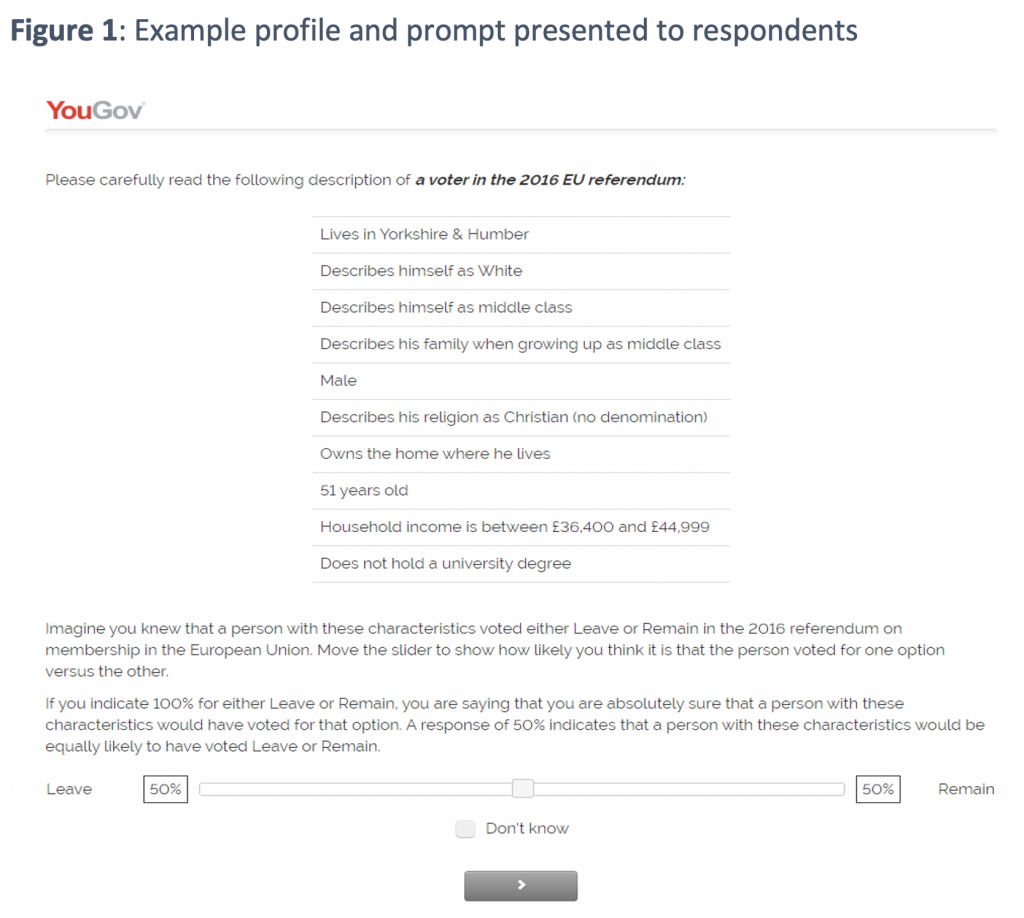
Are simplistic and deterministic associations a widespread phenomenon? Do people go around making snap judgments on how other people vote? To address these questions, we ran two survey experiments on representative samples of UK voters. In these experiments, we presented respondents with real demographic profiles of respondents to a previous survey (the 2017 British Election Study, the BES). We then asked them to guess how likely it was, on a scale from 0 to 100, that a person with this profile voted for or against Brexit and, in a different experiment, for Labour or Conservative in the 2017 election. We could then compare their answers with the actual votes of the BES respondent whose profile we showed them. Here in Figure 1 is an example of the presented profiles.
Do respondents accurately perceive the general tendency of voters in the UK to support Labour versus the Conservatives and Leave versus Remain? Because the profiles were randomly sampled from a nationally representative survey, we can benchmark the average perceptions with the true vote results. The average guess for the party experiment is 49.8% Conservative vote (95% interval 48.8-50.8), slightly lower than the true value of 51.4% of the two-party vote. In the Brexit experiment, the overall average guess is 56.5% Leave vote (95% interval 55.4-57.5), which is slightly greater than the true value of 51.9%. While these differences are statistically significant, they are not substantively large.
In the paper we show respondents’ guesses across the two experiments (Brexit and general election vote) reflected the patterns that existed in the vote across nearly every demographic dimension that we examined. We find only a single attribute where respondents are, in the aggregate, directionally mistaken (on average, respondents think that holding a university degree was associated with voting Conservative in 2017, when in fact it was associated with voting Labour).
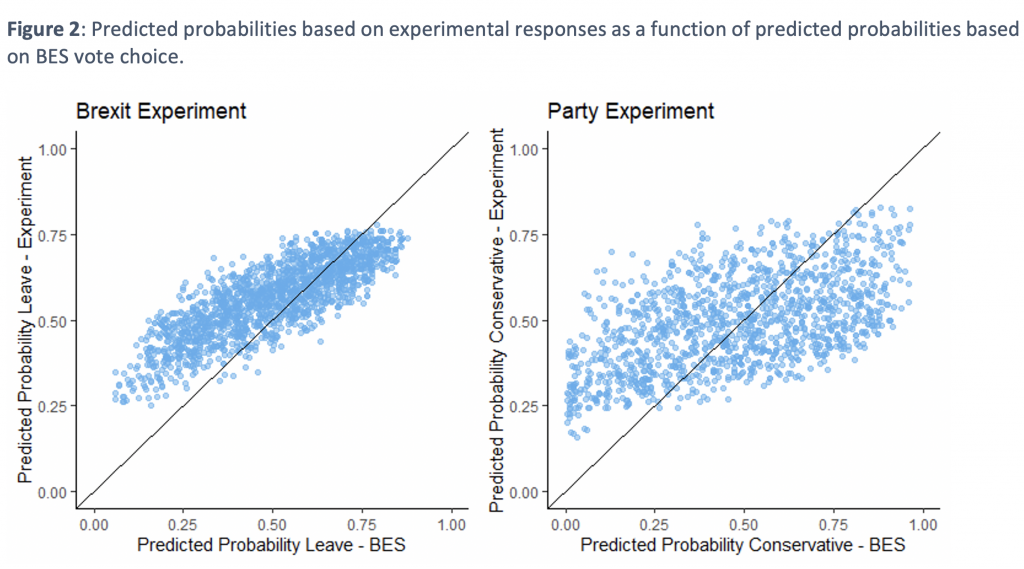
Likewise, respondents’ average guesses of how likely it is for a given profile to have voted in a certain way followed a similar pattern to what a prediction model based on the BES data directly would imply, which is one benchmark of what the ‘correct’ guess would be. Figure 2 presents, for a given predicted probability (x axis) of a profile, the average guess among respondents (y axis). A perfect guess would be reflected in all the points following the 45 degrees line. While there are some differences with the benchmark, we find that on average, people are responsive to the real demographic patterns in making theses guesses (more so for the Brexit experiment than the party experiment).
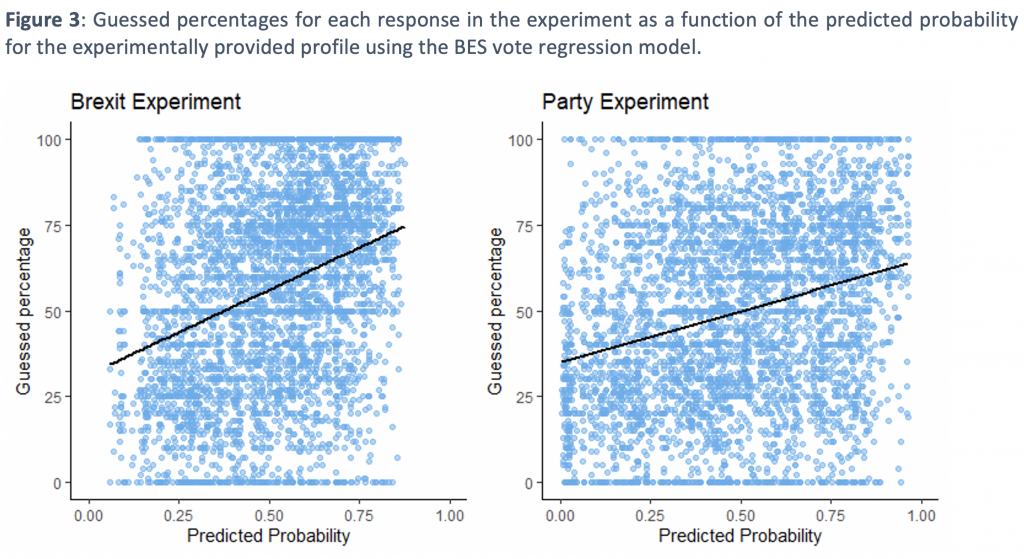
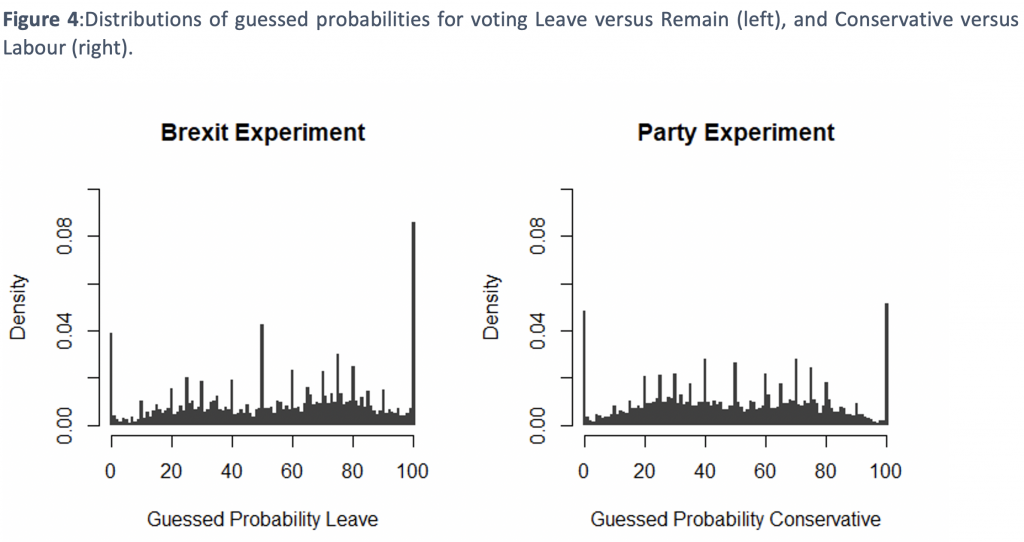
However, at the individual level, guesses were very noisy, with several respondents tending to an excess of confidence (likelihood too close to 0 or 100). This can be seen in Figure 3.
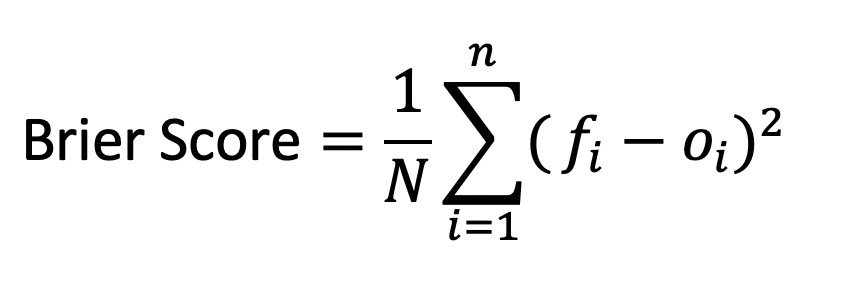
How inaccurate are individuals’ guesses? One of the ways we assess this is through the Brier Score, a tool from forecast evaluation, to assess respondents’ guesses as probabilistic predictions. If N is the total number of predictions, fi is the probability reported by a respondent and oi is the true vote of the profile shown to that respondent (which may take the values of 1 or 0):
Smaller Brier scores imply better predictions. The overall Brier score for all responses (using survey weights) is 0.302 for the Brexit experiment and 0.291 for the party experiment. In both cases this is worse (higher) than the score of 0.25 that results from simply guessing 50% for every profile in both experiments. The reason for this is that many respondents provide 0% and 100% responses, which are always overly confident probabilistic assessments given the limited predictive power of the profile attributes that respondents saw in the experiment. This tendency to choose extreme values can be observed in Figure 4.
What do our findings imply? Our analysis examines both individual-level and aggregate-level accuracy, because both are important features of public understanding of how different social groups vote. It is important to know if there are systematic biases that show up in the aggregate, but also whether individuals tend to have much usable information about these questions. If individual citizens have wildly divergent beliefs about the likely voter behaviour of their fellow citizens, that is important to know even if these divergent beliefs average out to something close to reality. There is a long ‘wisdom of crowds’ tradition of observing that, while individuals may be inaccurate, they could nonetheless be accurate on average. This is often explained as resulting from individuals each having only a few pieces of relevant information, with the process of averaging cancelling out the resulting idiosyncratic errors. This pattern of individual-level imprecision combined with aggregate-level accuracy is clear in our data, not only because different individuals may know about the political associations of different attributes, but also because of errors in probability reporting. Individual citizens are not good at providing well calibrated probabilistic assessments of how other specific citizens vote but their average guesses broadly reflect how major political cleavages relate to a variety of demographic characteristics.
Another way of phrasing these key outstanding puzzles is to ask whether citizens really believe their overconfident guesses. Is the problem with reporting or with their beliefs? For example, when someone reports 100% probability of a particular profile voting Leave, does that level of certainty really guide how they would interact with and think about someone with those characteristics? Are citizens going through the world making extremely strong snap judgments about the political alignments of those around them? Our finding that there is no one dominant pattern of such snap judgments in the aggregate does not mean that individuals are not doing this. Indeed, the implication of their numerical responses taken literally is that they are. However, further research is necessary to discern between the interpretation that people are just bad at reporting probabilities and the interpretation that they are making radically overconfident and often inaccurate evaluations of their fellow citizens.
______________________
Note: the above draws on the authors’ published work in Political Science Research and Methods.
 Noam Titelman is a PhD candidate in Social Research Methods at the LSE Methodology Department.
 Ben Lauderdale is Professor and Head of Department of Political Science at UCL.
Photo by Emily Morter on Unsplash.


