 In June 2013, the U.S. Supreme Court struck down part of the 1965 Voting Rights Act, prompting fears from many commentators about minority representation. Analyzing Congressional election results from 1960 to 2010, Barry Edwards argues that the Supreme Court’s finding that the Act’s historic coverage formula does not accurately reflect current political conditions is correct. He also finds that the Voting Right Act’s uniform redistricting standards are problematic because while they improve opportunities for African American voters, they are likely to diminish opportunities for Latino voters (and vice versa).
The U.S. Supreme Court’s decision to strike down a key component of the 1965 Voting Rights Act (VRA) last June closes one of the most successful chapters in the history of civil rights enforcement. The case of Shelby County, Alabama v. Holder may close one chapter, but if history is any guide, the story is far from over. I have tried to help policy makers address contemporary voting rights by looking at whether current political conditions for African American and Latino voters continue to justify the Voting Rights Act; if the VRA’s historic coverage formula (Section 4) was sufficiently tailored to the problems it addressed; and when minority voting rights are properly at issue, what remedies provide minority voters with equal opportunities to elect their preferred candidates of choice?
Before analyzing data, it is helpful to understand the law’s basic framework. The VRA provides two different mechanisms for protecting minority voting rights: Section 2 and Section 5. The most important difference between these two causes of action is who bears the initial burden of proof. In 1965, with Section 5, Congress singled out particular jurisdictions based on their maintaining tests or other devices as preconditions for registering to vote in 1964 and racial bloc voting. Covered jurisdictions included Alabama, Alaska, Arizona, Georgia, Louisiana, Mississippi, South Carolina, Texas, and Virginia (along with a number of local governments). Section 5 was originally intended to remain in effect only five years, but Congress renewed and extended it, along with the coverage formula, in 1970, 1975, 1982, and 2006.
In Section 5 cases, covered jurisdictions are to pre-clear changes to their elections laws, like drawing new congressional district boundaries following a national Census, with the United States Attorney General. In cases premised on Section 2, which applies nationwide, minority voters must prove that the totality of circumstances warrant judicial intervention into the electoral process. Because Section 5 shifts the costs of litigation from voters to covered jurisdictions, there are many more Section 5 enforcement actions than Section 2 actions.
I analyze congressional election results from 1960 to 2010 to understand why African American and Latino voters succeed in electing their “preferred candidates of choice” to Congress. The phrase “preferred candidates of choice” can be difficult to interpret, but I focus on it as the outcome of interest in the area of voting rights. I estimate the probabilities of African American and Latino voters succeeding in electing their preferred candidate to Congress as a function of district demographics and the race/ethnic of incumbent candidates. It should come as no surprise that the probability of minority voters electing their preferred candidate to Congress increases with the proportion of minority voters in a district, but it is important to know whether this relationship has changed over time, how it varies among the states, and what district composition offers equal opportunity.
Political Conditions Still Challenging for African American and Latino Voters
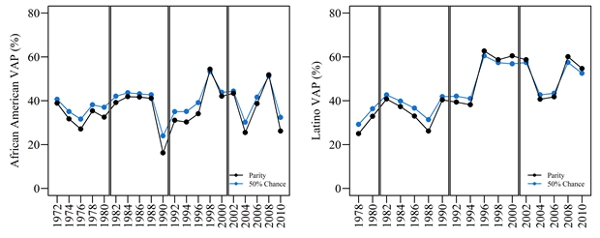
Are opportunities for minority voters in congressional elections significantly different today than they were in past decades? As Figure 1 illustrates, the relationship between district composition and minority voters’ success is not fixed but rather fluctuates over time. The upper panels map the estimated probabilities of minority voter success in open-seat elections at varying district compositions over time. The lower panels plot the compositions corresponding to 50% probability of success as well as the compositions corresponding to the fairness condition, where the probability of a minority electing its preferred candidate is equal to the group’s proportion in the district.
Figure 1 – Changing Effect of Minority Voter Populations on Electoral Success in Elections without White Incumbent Running for Re-Election
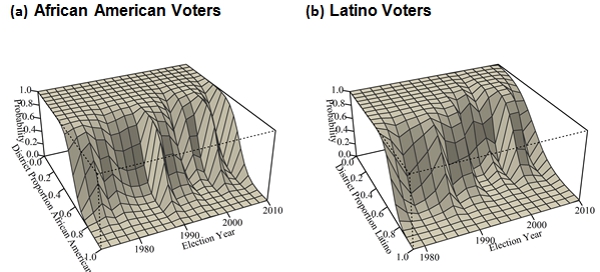
Note: VAP=voting age population
Despite these changes over time, political conditions have not evolved to the point that the VRA redistricting guidelines are unnecessary. Consider what one would expect if all districts were microcosms of the United States. Based on recent elections, the probability that a nationally representative district elects an African American to an open seat in Congress is 0.85 percent, a Latino, 0.47 percent. One would expect 435 such districts to elect four African Americans and two Latinos to Congress; the proportion of minorities in the general population would be over fourteen times greater than in Congress.
Historical Coverage Formula Does Not Reflect Current Political Conditions
How do the prospects for minority voters in states covered by Section 5 compare to those in states that are only subject to Section 2? According to my analysis, the geographic coverage of Section 5 was related to the particular challenges that minority voters face in some states, but not tailored to contemporary conditions.
Figure 2 – Historic Coverage Formula v. Current Political Challenges
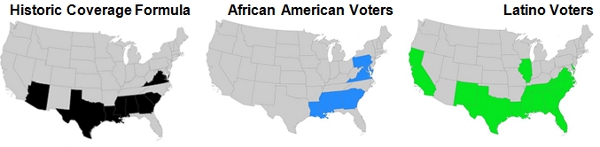
The maps in Figure 2 above highlight the states historically covered by Section 5, states more challenging for African American voters than the national average, and states more challenging for Latino voters than the national average. Alaska (a Section 5 state) cannot be distinguished from national averages because Alaska has only one congressional district with relatively few minority voters. There is at best a loose fit between the historic coverage formula and current political conditions for minority voters. These results support the Shelby County decision.
Distinct Challenges for African American and Latino Voters
Translating statistical results into practical redistricting guidelines is complicated by the variation of political conditions for minority among states, state demographics and geography. Taking all of these factors into account, I forecast expected electoral outcomes from a range of VRA thresholds given varying state characteristics.
Figure 3 – Expected Minority Representation at Varying VRA Targets
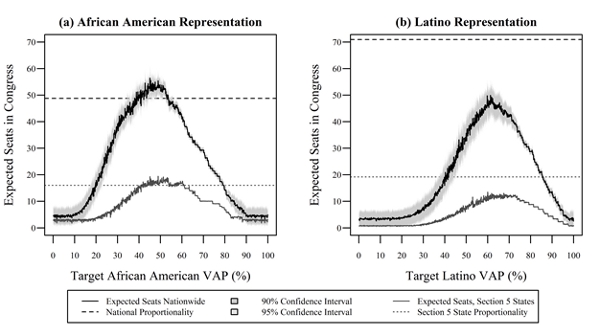
As Figure 3 illustrates, African American voter success is maximized by a nationwide standard of 46.8% African American VAP. Setting VRA targets higher than 55% can be expected to reduce voting power for African American nationwide. In contrast, Latino representation is maximized targeting 61.2% Latino VAP.
The prevailing legal interpretation of the VRA favors a bright line rule for majority-minority districts and uniform treatment of minority voters. Setting a uniform standard is likely to improve electoral prospects for one group by dampening prospects for the other group. While both African American and Latino voters benefit from avoiding extremely low or high redistricting standards, there is not a standard district composition that provides both groups with equal opportunities.
Equal Opportunity in Multicultural America
In order to implement standards that provide minority voters with equal opportunities to elect their preferred candidates, we must develop a better concept of what constitutes fairness. Courts have generally considered whether minority voters’ opportunity to elect their preferred candidate is equal to that of white voters. But this concept of equal opportunity is crude and does not work.
The relevant inquiry should not be whether a minority candidate has an equal opportunity for success as his or her opponent, but rather whether minority voters have an equal opportunity to elect their preferred candidates compared to other voters’ ability to elect their preferred candidates. Rather than providing candidates even odds, we should think about equalizing the probability that minority group elects its preferred candidate with its proportion of a district population.
This article is based on the forthcoming paper ‘Formulating Voting Rights Act Remedies to Address Current Conditions’, in American Politics Research.
Please read our comments policy before commenting.
Note: This article gives the views of the author, and not the position of USApp– American Politics and Policy, nor of the London School of Economics.
Shortened URL for this post: http://bit.ly/1koQFgg
_________________________________________
Barry Edwards – University of Central Florida
Barry Edwards is in the Department of Political Science at the University of Central Florida. His research interests include elections and legislative behavior, the U.S. presidency, adjudication and alternative dispute resolution, and state politics.