 In recent years, smartphones have changed the way that we interact with the web – and each other. But have they changed the way that we shop online? In a recent study of internet and mobile eBay transactions, Liran Einav, John Levin, Igor Popov and Neel Sundaresan, find that mobile adopters tended to be heavy eBay users, and tended to buy more using their mobiles, while their non-mobile purchases stayed largely the same. They also find that their mobile shopping behaviors in terms of prices and products are little different to those on eBay’s internet site.
_
Mr. Spitz said he was recently stopped at a traffic light and the sun was bothering his eyes. By the time the light turned green, he had used his phone to order and pay for sunglasses. (New York Times, June 27, 2012)
In the United States, the majority of adults have a smartphone, and increasingly phones are the way we go online. Just as the internet disrupted the retail industry in the late 1990s, the transition to mobile, or “Web 3.0,” may have a similar effect.
In a recent study, we used data from eBay’s mobile shopping app[lication] and core internet platform, comprising around 1 percent of all eBay users, to document some early effects of mobile devices on internet and retail commerce. In the U.S., eBay transactions account for a significant share of total internet commerce ($67.8 billion in 2012), and eBay users appear to be fairly representative of the population of internet shoppers. According to comScore, eBay has the second most smartphone visitors of any retail website, after Amazon, with 30 million unique smartphone visitors in July 2012, and mobile transactions in 2012 were $13 billion.
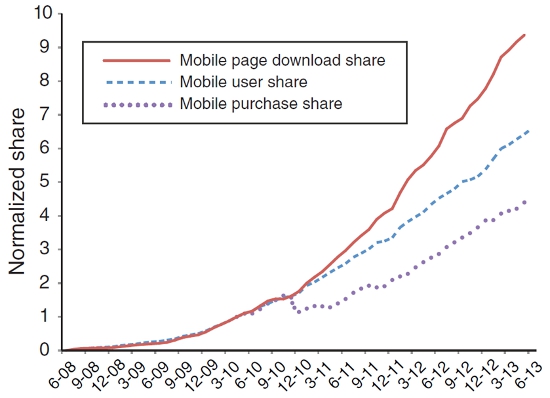
Figure 1 shows the striking growth of eBay mobile use. From zero in 2008, mobile- originated transactions (here defined as “standard” eBay transactions via auctions or “Buy It Now” fixed prices) have been growing rapidly, increasing by a factor of ten in just a three-year period (April 2010 to April 2013). The share of mobile browsing activity—as measured by the number of page downloads—has also increased, although at a somewhat slower pace. Figure 1 also presents a similar trend in terms of users. We say that a user has adopted mobile when he makes his first mobile purchase. By June 2013, more than one-third of eBay’s active users (in a given month) were mobile adopters. Moreover, the monthly adoption rate (the number of new adopters in a month over the number of users yet to adopt) had increased to over 7 percent in early 2013.
Figure 1 – Growth of eBay mobile 2008-2013

Notes: This figure plots three variables in a monthly time series: mobile purchase share, mobile user share, and mobile page download share. The mobile purchase share represents the fraction of purchases initiated using a mobile app. Monthly mobile user share is the share of all users making a purchase in a given month who had made a mobile purchase in or prior to that month. Page download share is the ratio between the number of mobile page downloads and the total number of eBay page downloads. Each time series is normalized by its April 2010 level (the first month for which we have reliable mobile page download data).
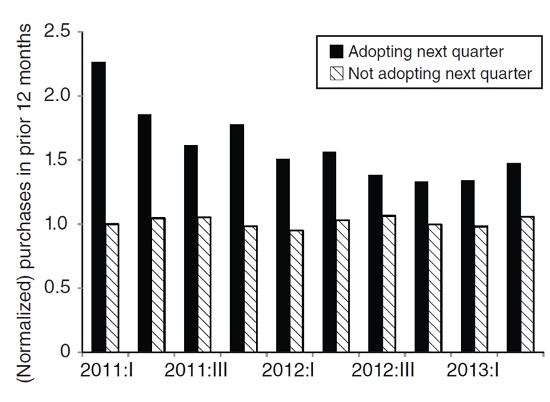
Our study turned up several facts about the nascent transition to mobile. A first and not surprising finding was that the early adopters of eBay’s mobile e-commerce app were already relatively heavy eBay users, as Figure 2 illustrates. For example, users who adopted mobile in the first quarter of 2011 were about twice as active pre-adoption as users who did not immediately adopt the mobile app, and even as of the middle of 2013, new adopters were about 50 percent more active on the platform than users who had yet to adopt the mobile app.
Figure 2 – Mobile adopters vs non-adopters

Notes: This figure explores how mobile adopters differ from nonadopters in their core site usage. We define mobile adoption as a user’s first mobile purchase. For each quarter, we divide all active users who have never purchased anything through a mobile application into two groups. The first group consists of those users who will make their first mobile purchase in the following quarter. The second group consists of users who will not adopt next quarter. For each group of users, we plot the mean number of purchases over the prior year, normalized by the mean of 2010 purchases for 2011:I nonadopters who did not make a mobile purchase in 2011:II.
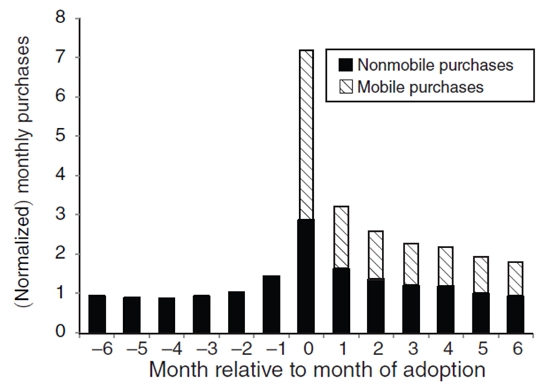
A less obvious finding was that adopting the mobile shopping app was associated with both an immediate and sustained increase in total platform purchasing, as Figure 3 illustrates. Presumably at least some users download the mobile application because they want to do some shopping immediately, but even six months after adoption, we observe but overall purchasing doubles (on average) as a result of incremental purchasing activity via the mobile app, and there has been essentially no decrease in non-mobile purchases.
Figure 3 – Purchasing effects of mobile adoption

Notes: Figure plots the mean (normalized) monthly number of purchases for the six months before and six months after the month of mobile adoption (month 0). Adoption is again defined by the month in which a user first makes a mobile purchase. The data consist of all 2012 adopters in our sample that first browsed eBay at least six months before mobile adoption. We calculate mean purchases for each adoption month separately and construct the average over months relative to adoption, weighted by the number of adopters in each month. Thus, the −6 value is averaged over July 2011 purchases of January 2012 adopters, August 2011 purchases of February 2012 adopters, and so on. We then normalized the monthly number of purchases so that the height of the −6 to −1 bars average to 1.
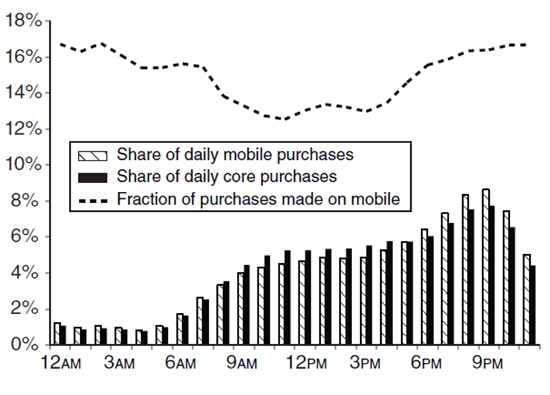
The last finding was remarkable mainly for what we did not find. We do not see much difference in mobile and non-mobile shopping behavior. Although we see some differences in browsing patterns, the type of products people purchase, the prices at which they purchase, and so forth, are not very different. Indeed, it appears that a lot of “mobile” shopping is not very mobile. As Figure 4 shows, the use of mobile devices for shopping, relative to non-mobile devices, is highest in the late evening — at bedtime!
Figure 4 – Timing pattern of mobile purchases

Notes: Distribution of core and mobile purchases by hour of day (buyer’s local time) for weekdays in 2012. Share of daily mobile (core) purchases represents the fraction of daily mobile (core) purchases made in each hour. The dashed line represents the share of total purchases in each hour initiated on mobile. For auction bids, we use the timestamp of the winning bid rather than the auction’s end.
Of course, mobile devices and applications, and the way people use them, are evolving rapidly, and it may be too early to pick up transformative changes in the data. For instance, marketing and advertising may end up being quite different on small mobile screens than on desktop computers – at this point they are not yet so different.
None of our findings indicate so far a transformative use of mobile devices in offline shopping—indeed one could read the time use statistics as suggesting that tablet devices are primarily changing home shopping behavior. However, it does seem likely that mobile devices will change offline shopping by allowing shoppers to access reviews and pricing information, or by receiving personalized marketing or assistance while in a store. Mobile technology also may have less direct but nevertheless consequential effects, for instance by facilitating the development of same day delivery services. As is the case with many general purpose technologies, however, it will take some time for the effects of mobile internet devices to be sorted out.
This article is based on the, “Growth, Adoption, and Use of Mobile e-Commerce,” in the American Economic Review Papers and Proceedings.
Featured image credit: Jason Howie (Creativ Commons BY)
Please read our comments policy before commenting.
Note: This article gives the views of the author, and not the position of USApp– American Politics and Policy, nor of the London School of Economics.
Shortened URL for this post: http://bit.ly/1naURNY
_________________________________
 Liran Einav – Stanford University
Liran Einav is a Professor of Economics at Stanford University. His current research focuses on empirical work in insurance and credit markets, and his broader interests include industrial organization, micro-economic theory, applied econometrics.
_
 Jonathan Levin- Stanford University
Jonathan Levin is Professor and Chair of the Department of Economics at Stanford University, and Professor by courtesy in Stanford’s Graduate School of Business. His research is in the field of industrial organization, particularly the economics of contracting, organizations, and market design.
_
 Igor Popov – Stanford University
Igor Popov is a PhD candidate at the Department of Economics at Stanford University.
_
 Neel Sundaresan – eBay Research Labs
Neel Sundaresan is the Senior Director at eBay Research Labs where he leads the research team in areas like Search, Machine Learning, Big Data Science, and Vision, among others. Prior to joining eBay he was a founder, CTO of a network CRM company and prior to that he was a manager of the eMerging Internet Technologies group at IBM Almaden Research Center.


