

 This midterm cycle, much commentary has been focused on Senate races, given that the Republican Party looks very likely to hold and increase its seats in the House of Representatives. But how many House seats should the GOP expect to win? With a week to go, Joseph Bafumi, Robert S. Erikson, and Christopher Wlezien give an updated House forecast. They write that a combination of the GOP’s incumbency advantage, their domination of state legislatures (and thus, redistricting) since 2010, and U.S. internal migration, mean that the Republican Party are likely to win about 244 seats on November 4th.
The Bafumi-Erikson-Wlezien team first modeled the US House election results in 2006, and were among the first to predict the return of the Democratic majority, with our forecast off by only two seats. We applied our model again in 2010 and, like most other forecasts; we predicted a Republican takeover in 2010, underestimating the GOP swing by 13 seats. We presented our 2014 midterm forecast at the 2014 American Political Science Association convention in late August, and revised only marginally for the October issue of Political Science.
Our forecast for 2014 using polls from early in the election year is a GOP seat gain of 14 seats beyond what the GOP obtained in the 2012 election. If this happens, the size of the Republican majority would expand to 248 seats, and they would hold six more seats than following their record-shattering showing in the 2010 “wave” election. This predicted seat division actually is based on the expectation of a slightly slimmer GOP margin (52.5-47.5) than in 2010 (53.5-46.5) in terms of the national vote. This votes-seats discrepancy is due to three changes in the political environment between 2010 and 2014 that affect the translation of the partisan vote into the national division of seats.
- First, unlike in 2010, it is now the Republicans who have the benefit of incumbency in Congressional districts that would normally be competitive. (In seats that were competitive between the parties in 2010, incumbency provided some protection to vulnerable Democrats. Now it is Republican incumbents who enjoy this cushion.)
- Second, in 2014 the Republicans benefit by their domination of state legislatures following the 2010 US Census. The legislatures draw the district lines for the 2012-2020 elections and most were in Republican hands, thanks to the 2010 election. This post-2010 census redistricting by Republican-dominated state legislatures enhances the “natural” gerrymander from the way Democrats and Republicans cluster geographically.
- Third, seats in 2010 were allocated to the states based on the 2000 census rather than the 2010 census as in 2014. This matters because the pattern of internal migration within the US is from Democratic areas to Republican areas. In 2010, the Democrats were able to staunch their bleeding somewhat because, relatively speaking, they benefited from underpopulated “rotten boroughs.” In 2014, this is no longer the case.
Our model has two steps. The first step predicts the national vote division from two variables, the generic poll result and the party of the president. With this estimate of the partisan tide, the second step forecasts the winners of 435 House races using separate models for open seats and races with incumbent candidates. At both steps, the forecast takes into account uncertainty about the inputs and their effects. The final product of our simulations is a prediction of the partisan division of House seats, as well as a probabilistic statement regarding the likelihood of the parties’ control of the chamber.
Step 1: Predicting the Vote
Using past elections as a guide, we model the national vote as a function of the vote division in generic ballot polls 5 to 6 months before the election plus a simple dummy variable for which party holds the presidency. (Generic ballot polls ask respondents which party—but not which candidate—they would vote for in the upcoming election.) It is well-known that voters tend to punish the incumbent president’s party during midterm elections, and we have shown, based on past congressional campaigns, that generic polls persistently underestimate the ultimate support for the non-presidential (“out”) party. The underestimate is greatest early in the election year and recedes as the campaign progresses, whereby poll respondents increasingly take into account the party of the president when reporting their generic vote. As the campaign progresses, voter preferences tilt toward the out-party. Our interpretation is that voters seek more ideological balance between the president and Congress.
For 2014, our specific forecast is that the Democrats will win 47.5 percent of the two-party vote and the Republicans the remaining 52.5 percent. Of course, we are not absolutely sure that this will be the vote; what we really are forecasting is a distribution of likely results. To take into account the uncertainty, we simulate the vote in 1,000 “elections” based on the forecast error associated with our prediction for 2014.5 This yields a probability density as a distribution around the forecast of the national vote. By this estimate, the 95 percent confidence band is a range from 44.7 percent to 50.3 percent Democratic. In other words, the Republicans are almost certain to win the popular vote.
Step 2: Predicting Seats
Next, we need to determine how the swing in national vote will impact the number of actual seats the parties win. For each simulated value of the national vote, we need to simulate the outcome in the 435 congressional districts. Using OLS, the first step is to model the vote in individual seats as a function of the vote margins for the House and the president in 2010. Open seats and incumbent-contested seats are modeled separately. We assume that 2014 follows the parameters of 2010, except for the mean vote division, which is estimated from our model of the national vote in step 1. (For more details, see our complete article.) Using the 2010 equations, we substitute the expected national vote in 2014 for the national 2010 vote in the model.
Our simulations incorporate the uncertainty from our modeling. For each of our 1000 simulation, we draw the national vote from the mean and variance of our vote model. For each simulation, our district-level predictions take into account the uncertainty from our modeling of the vote in districts when the national vote is known. Our seat prediction and the ultimate uncertainty are represented in Figure 1. There we can see a lot of red and very little blue, which means that the Republicans are almost certain to retain control of the US House.
Figure 1 – Results of district level predictions
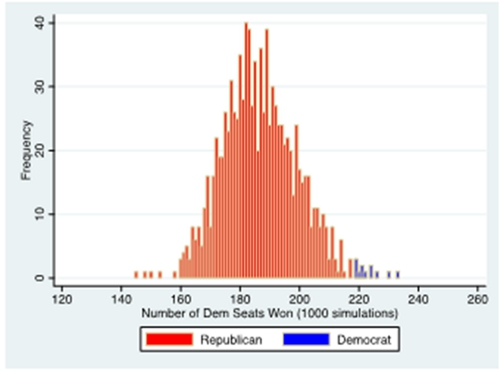
Note: The Republicans win the majority of seats in 99 percent of the trials. On average, the Republicans win 248 seats, increasing their margin substantially over what the won in the 2012 election. However, the simulations yield considerable variation, with a 95 percent confidence interval of 228 to 268.
Update
Out of necessity our 2014 forecast for APSA and PS was based on polls conducted five and six months in advance of the election. Would the results change if we use more recent polls? One interesting facet of our modeling of House elections is that the accuracy of the model varies little with the time interval from the polls to Election Day. (The later we take readings of the polls, the more accurate they become, but the coefficient for the presidential party variable recedes in relevance.) Our update based on more recent polls within 60 days of the election drops the mean forecast to 244 Republican seats, still a couple more than the GOP’s 2010 yield. The slight forecast shift results because the polls have not shifted as much in the Republican direction as we would expect for the out-party in the final months of the campaign.
This article is based on the paper ‘National Polls, District Information, and House Seats: Forecasting the 2014 Midterm Election‘ in PS: Political Science and Politics.
Featured image credit: Ron Cogswell (Flickr, CC-BY-2.0)
Please read our comments policy before commenting.
Note: This article gives the views of the author, and not the position of USApp– American Politics and Policy, nor of the London School of Economics.
Shortened URL for this post: http://bit.ly/10vd8Cg
_________________________________
Joseph Bafumi– Dartmouth College
Joseph Bafumi is an Associate Professor of Government at Dartmouth College.
_
Robert S. Erikson– Columbia University
Robert S. Erikson is Professor of Political Science at Columbia University. He is co-author of The Timeline of Presidential Elections (University of Chicago Press), The Macro Polity (Cambridge University Press), and American Public Opinion (Pearson).
Christopher Wlezien– University of Texas, Austin
Christopher Wlezien is Hogg Professor of Government at the University of Texas at Austin. He is coauthor of Degrees of Democracy (Cambridge University Press) and The Timeline of Presidential Elections, and currently is Associate Editor of Public Opinion Quarterly.