 Recent decades have seen youth turnout at elections at levels that are consistently lower than that of older voters. In new research, Scot Schraufnagel investigates the effects of candidates’ ages on youth turnout. He finds that young Americans are much more willing to vote when two younger candidates are running. By looking at youth turnout in more than 300 midterm races, he also finds that as the age gap between two candidates increase, then so does youth turnout.
The question of low voter turnout for young Americans has been debated in academic circles for the past 70 years. The main conclusion drawn is that arcane voter registration requirements are the leading institutional obstacle and that a general apathy is the chief psychological impediment. What has been missing from the debate is a complete dissection of the cause of political apathy among American youth.
Our research finds the relative age of the candidates running for public office contributes in a significant manner to an apathetic youth. Using a classic experimental design we learn that youth are more willing to commit to vote when they view photographs of younger looking candidates running in hypothetical elections. In a real-world test of our experimental results we learn youth in the United States have turned out to vote at higher rates when the candidate age gap is larger.
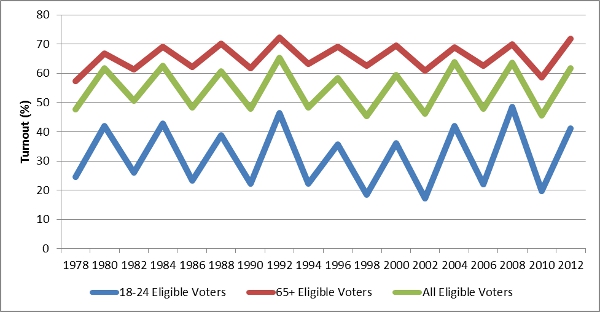
Figure 1 demonstrates lower youth voter participation rates in U.S. national elections, since 1978. Throughout we measure voter turnout as a percentage of the eligible voting population. From the Figure we learn the phenomenon of lower youth voter turnout has persisted into the 21st century. The largest disparity in voter turnout between the youngest and oldest age cohorts occurred just prior to the dawn of the 21st century in the 1998 midterm elections (44.1 percent). Empirically the gap in voter turnout between the youngest and oldest age groups has averaged around 33 percent since the late 1970s. The sawtooth pattern in the Figure results from the increase voter turnout that routinely occurs in U.S. presidential elections.
Yet, there is a second trend of interest in Figure 1 that is not obvious at first. Note less variation in the line representing voter turnout of the age group most likely to vote (65 and older). This compares to a line with comparatively more movement for 18 to 24 year olds. This extra volatility in aggregate youth voting suggests there may be factors in play which influence youth voter turnout that do not affect other age groups. We are suggesting that the relative age of the candidates running might explain some of the extra variation.
Figure 1 – Voter Turnout in U.S. National Elections: 1978-2012
In our experiment, we test respondent’s commitment to vote in a race with two old candidates running, a race with one old and one young candidate running, and a race with two young candidates. We used a sample of 691 young Americans, between 18 and 25, who were told that they were involved in research on candidate image. Approximately one-third of the students saw each of the three pairs of photographs.
All photos were of white males to control for possible racial and gender effects on a commitment to vote. The experiment also used two sets of six photographs to control for the possibility that a particular set of photographs was driving the results. As a screen for our true test, students were asked which candidate they would be more likely to vote for, and then, their likelihood of voting in each race on a scale ranging from ″1″ to ″10″ with ten representing the strongest commitment to vote.
In the end, we ran carefully constructed statistical models; however, as shown in Figure 2, a simple two-way test of the association between a commitment to vote and the photos makes our general finding clear.
Figure 2 – The Effect of Candidate Age on Young American’s Willingness to Vote
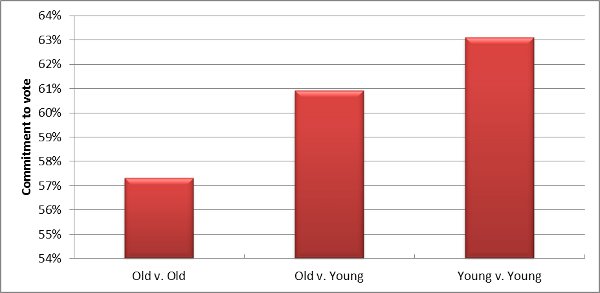
Note the increased commitment to vote when there were two younger candidates running. The differences between each of the three groups meet standard expectations for statistical significance. When we add control variables the differences become even sharper and we learn the odds of moving from one value on the commitment to vote scale to the next value in a positive direction is 1.37 times greater when there is one young candidate running and this grows to 1.56 times greater when there are two young candidates running.
Next, we look at real world scenarios, focusing on variation in youth voter turnout in the 50 American states in midterm Senate and gubernatorial races. The focus is on midterm elections to prevent the more high profile presidential races from corrupting the analysis. Most specifically, we collect data on two unique considerations of candidate age. We measure the age of the youngest candidate and the age gap between the two candidates who received the most votes. In all we study 349 races over five midterm elections (1994, 1998, 2002, 2006, and 2010).
Importantly there were only four races where the youngest candidate was under the age of 35. In each of these races the gap between youth voter turnout and the voter turnout of the 25+ population got smaller than it had been in the previous midterm election. In other words, young adults’ turnout levels were more like the rest of the country when there was a candidate under the age of 35 running.
We also learn an increase in one year in the candidate age gap, considering all 349 races, associates with about a 0.1 percent increase in youth voter turnout, on average. Put differently, an increase in the candidate age gap of 30 years (e.g. one candidate is 35 and the other is 65 years of age) increased youth voter turnout by about three percent (0.1 * 30). This is the case after controlling for a whole host of other considerations that also influence youth voter turnout, including the state unemployment rate and state voter registration barriers.
This article is based on the paper ‘Candidate Age and Youth Voter Turnout’, in American Politics Research.
Featured image credit: Adam Scotti (Flickr, CC-BY-NC-SA-2.0)
Please read our comments policy before commenting.
Note: This article gives the views of the author, and not the position of U.S.App– American Politics and Policy, nor of the London School of Economics.
Shortened URL for this post: http://bit.ly/1G8nfKq
_________________________________
Scot Schraufnagel – Northern Illinois University
Scot Schraufnagel is the director of graduate studies for the Department of Political Science at Northern Illinois University. His research and teaching specialties are the U.S. Congress, political parties, elections, and state government, with an emphasis on promoting a civil, representative, and effective legislative process in the United States. He has a broad interest in institutional effectiveness and policy making, with a particular academic focus on legislative innovation. His published works have dealt with specific public policy innovations, institutional arrangements that promote effective elections (worldwide), partisan difference in the U.S. Congress, and the factors associated with a productive U.S. legislature.


1 Comments