

 An exploratory study on the magnitude, geographical distribution and effects of green employment in the United States from Francesco Vona, Giovanni Marin, and Davide Consoli.
Addressing grand environmental challenges (e.g. climate change) entails adapting the skill base and, thus, the composition of the workforce. Recent interventions both in the form of environmental regulation or of subsidies – i.e. the American Recovery and Reinvestment Act (ARRA) of 2009 and its green component, which accounts approximately for 15 per cent of the overall fiscal stimulus – revived the debate on whether environmental policies create or destroy employment. However, existing empirical evidence on green employment is limited in terms of timespan and scope due to data constraints.
In a recent study (Vona et al., 2018), we tackle this gap by elaborating a novel approach to measure green employment in US local labour markets. Using the task approach to approximate the time a worker spends in green activities (Acemoglu and Autor, 2011), allows us to provide a nuanced picture of how green employment has evolved in the turbulent period between 2006 and 2014 as well as a suggestive estimation of the effect of “becoming greener” for local labour markets.
Descriptive analysis reveals that green employment is pro-cyclical, highly skilled, commands a 4 per cent wage premium and is geographically concentrated. Green employment dynamics positively correlates with local green subsidies within the American Recovery and Reinvestment Act, local green knowledge, and resilience to the great recession. Finally, we find that one additional green job is associated with 4.2 (2.2 in the crisis period) new local jobs in non-tradable non-green activities.
Measuring green employment: a task approach
The empirical identification of green employment is challenging for two reasons. First, it is not easy to define what a green job is, considering the ample spectrum of actions devoted to environmental sustainability from, e.g., reducing pollution and resource exploitation, to preventing pollution by reducing the use of energy and materials. Second, and partly as a reflection of the former, uncoordinated data collection on the part of national statistical offices have given way to different, often incoherent, empirical accounts. Existing data collection methods (for example, the US Bureau of Labor Statistics’ Green Goods and Services Survey) approximate the share of green employment with the share of green goods over total production of surveyed companies, thus inferring green jobs indirectly at best from industry or product characteristics. These approaches do not shed light on the effective engagement of workers with activities aimed at developing and using green technologies and environmentally-efficient production methods on the workplace.
Using data from the Green Economy program of the Occupational Information Network (O*NET), we quantify workers’ dedication to green activities by computing each occupation’s ‘greenness’, that is, the ratio between the importance of green occupational tasks and the total (importance-weighted) number of occupational tasks. While other approaches to measuring green jobs are based on a dichotomy – i.e. a job is either green or not – the greenness is a continuous measure that proxies the work time devoted to green activities (e.g. conservation of energy and materials, production, design and use of clean technologies) relative to non-green activities by the typical employee in an occupation. Thereby, the occupational ranking by greenness encompasses (i) jobs that carry out primarily green tasks (e.g., environmental engineers, solar photovoltaic installers or biomass plant technicians) (ii) occupations wherein environmental work tasks are part of a broader set of activities (e.g., electrical engineers, metal sheet workers or roofers) and, importantly, (iii) jobs that engage environmental tasks only occasionally (e.g., traditional engineering occupations, marketing managers and construction workers). In short, our approach moves away from the traditional dichotomy ‘green economy vs the rest’ and emphasises the idea that all occupations potentially engage with green activities to a varying degree. This implies that the greening of our economies is no longer restricted to renowned flagship activities (i.e. wind energy generation) but is rather a widespread transformation.
Stylised facts
The task-based definition of green employment is operationalised with the aim of identifying a series of key stylised facts. To this end, we pair data on job task requirements from O*NET with the occupational employment statistics (OES) of the Bureau of Labor Statistics (BLS) on 826 occupations (six digit of the standard occupational classification, SOC) across 537 metropolitan and non-metropolitan areas over the period 2006–2014.
Fact #1: Green employment is more pro-cyclical and grows faster than total employment
Figure 1 shows that our estimate of green employment (GE) in the US oscillates around 3 percent employment share between 2006 and 2014. The trend in the figure indicates a contraction during the peak of the great recession, thus suggesting that green employment was more elastic to (declining) household incomes compared with total employment. By 2012, green employment had fully recovered and grown to its peak level of 3.1 per cent of total employment in the last year of our analysis. In absolute terms, green employment was approximately 7.3 per cent higher in 2014 than in 2006, while total employment grew by just 1.9 per cent over the same period.
Figure 1 – Share of green employment over total employment for the US
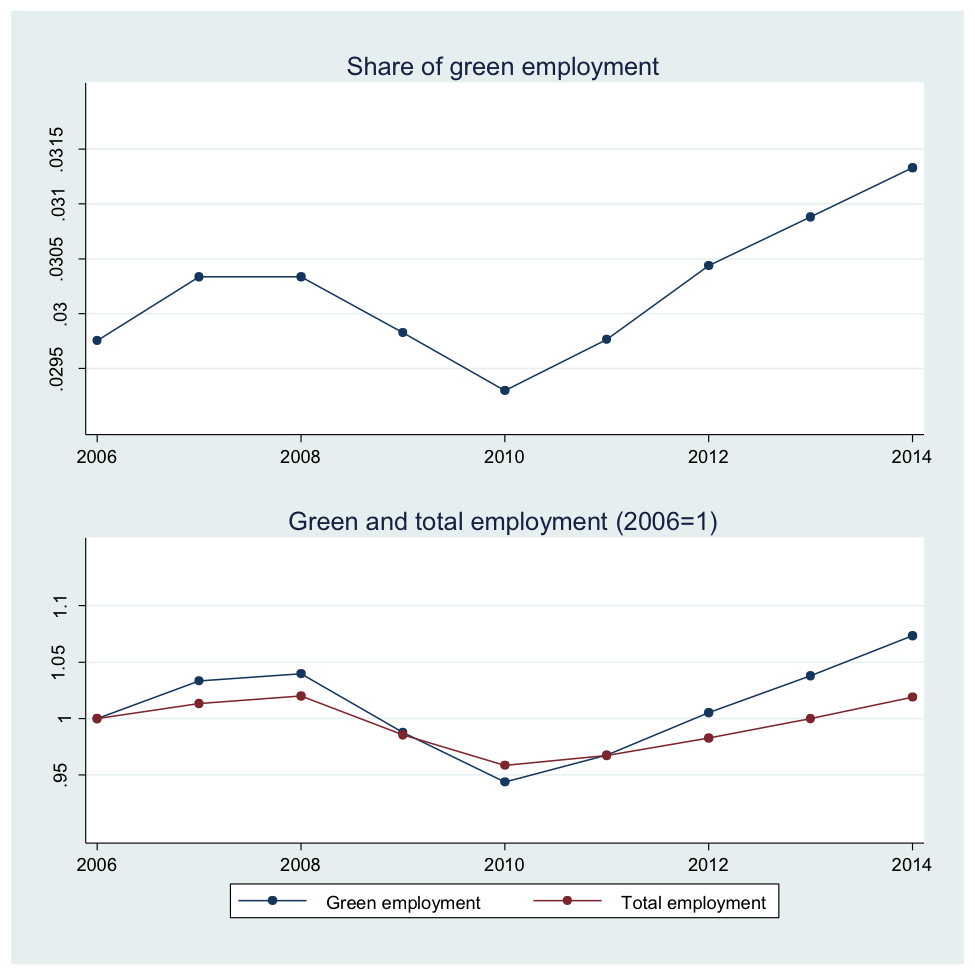
Source: Vona et al., 2018
Fact #2: Green jobs are mostly high-skilled jobs
Table 1 reports for major occupational groups, the initial share of green employment, the growth of green employment as well as the average years of education required by green and non-green jobs. Therein, we observe that 60.6 per cent of total green employment is in high-skilled occupations, and that this has grown substantially from 58.2 per cent in 2006 to 64.3 per cent in 2014. The GE share among high-skilled, abstract occupations (managers, professionals and technicians) is higher relative to low-skilled, manual occupations, with the exception of installation and maintenance jobs. Indeed, low-skilled green jobs, especially those more directly exposed to the crisis, such as construction, experienced a sharp contraction.
Table 1 – Green employment by occupational groups in the US (click to enlarge)
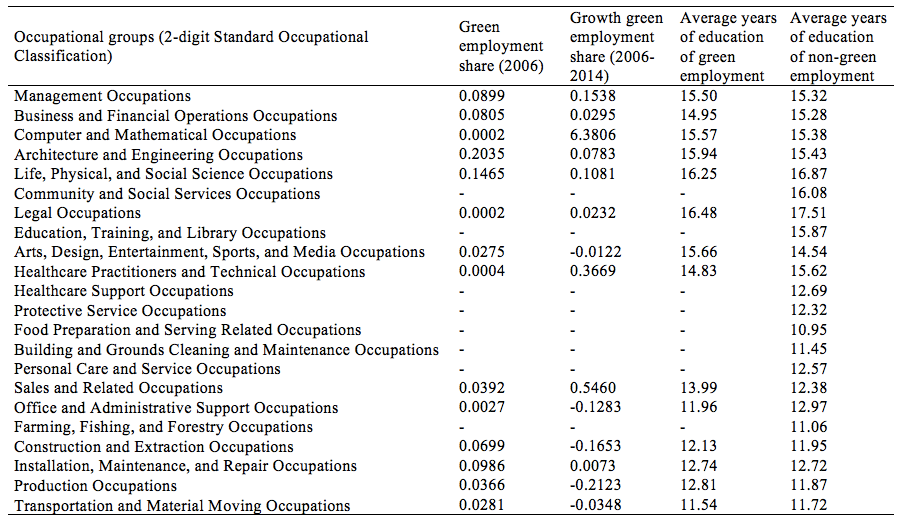
Source: Vona et al., 2018
Fact #3: Green jobs pay a mean wage premium of 4 per cent
Using average hourly wage estimates by detailed occupation, we estimate that being employed in a green job carries a wage premium of approximately 4 log points compared to employees in similar non-green occupations. Noticeably, low-skilled green occupations enjoy a significantly higher wage premium relative to high-skilled green occupations, 8 rather than 2 per cent. While the green wage premium for high-skilled jobs steadily declines from 2008 onwards, the premium for low-skilled jobs is stable before 2011 and increases afterwards.
Fact #4: There is a convergence of areas with a lower share of green jobs, although green employment remains more concentrated especially in high-tech areas.
The plot in Figure 2 show that the geographical concentration of green occupations, i.e. the extent to which green jobs cluster in particular areas, first declines and then stabilises at a level significantly higher than that of occupations with similar characteristics. A synthetic profiling highlights the following common characteristics of areas with the greater increase of GE: higher per capita income, higher probability of hosting high-tech clusters and public R&D labs, a stronger propensity to innovate (stock of green patents per capita) and higher-than-average share of employment in high-tech manufacturing and knowledge-intensive services.
Figure 2 – Concentration index of occupations across metropolitan and non-metropolitan areas
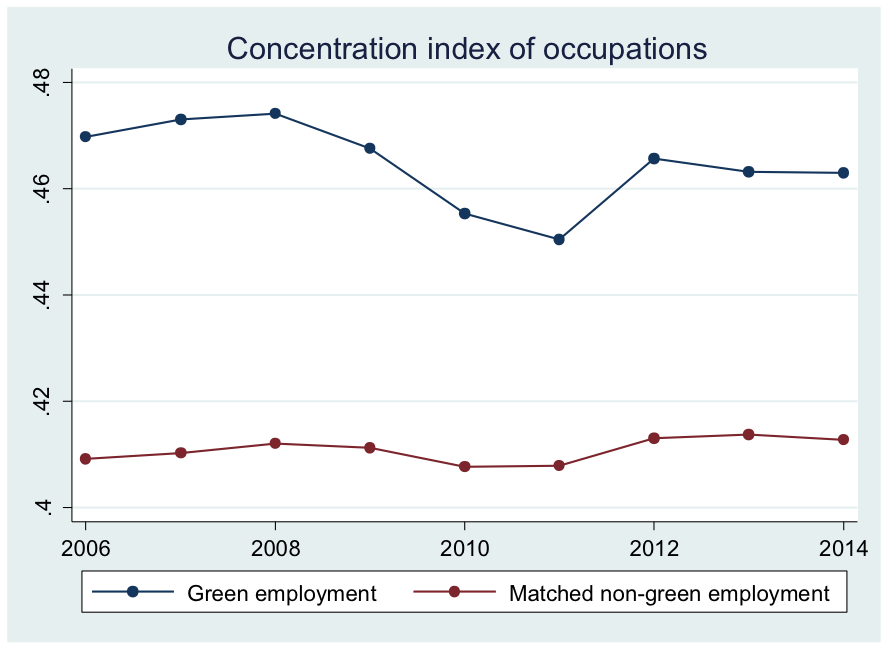
Source: Vona et al., 2018
Green employment and structural factors
We then analyse the drivers of green employment in local labour markets. Important to this goal is the coincidence of the onset of crisis on the one hand and the adoption of policies to promote the green economy on the other hand, in particular the green component of the American Recovery and Reinvestment Act. To compare the influence of the latter with structural forces, such as local resilience to the great recession and local exposure to trade and technology shocks, we regress the 8-year change of the green employment share on environmental policies, initial levels of these drivers as well as a host of auxiliary controls, such as the amount of non-green ARRA subsidies.

Although our results cannot be interpreted as causal effects, we find a strong association between the local green ARRA subsidies and the 8-year change of green employment. Moreover, we further corroborate our stylised facts by showing that the growth of green employment is positively associated with the local endowment of green knowledge and the resilience in the face of the great recession. Finally, our estimates suggest that only green ARRA has a positive correlation with the growth of both green and non-green employment.
Local multiplier effect of green jobs
Does the greening of the economy carry positive effects beyond environmental goals? We use the ARRA stimulus of 2009 (0.3 per cent of the US GDP) as policy shock to assess whether the emergence of new green activities is beneficial to local employment.
We estimate the local green job multiplier, namely the effect of creating one additional green job on local employment in the non-tradable sector (Moretti, 2010; Faggio and Overman, 2014), and find that one additional green job generates 4.2 new jobs in the non-tradable non-green sector. This is robust to various definitions of non-tradable non-green sector. To illustrate, our result is close to that observed in high-tech manufacturing jobs (upper bound) and well above the multiplied found in mining jobs. Moreover, the green multiplier hangs on around a remarkable 2.2 during the recessionary phase, 2006–2010. Because local green ARRA spending is strongly correlated with both green and total job creation, this finding lends support to arguments in favour of using green subsidies as place-based policy.
Ways ahead
Our estimation of the green job multipliers does not isolate the effect associated with green ARRA from that of other drivers. A more precise assessment of the differential impact of the green economy on growth and of the green stimulus package calls for further analysis at different levels of geographical aggregation based on data on green production and export. Another open issue is the extent to which these findings on the US compare to other countries. Moreover, the job-creation potential of green employment needs to be contrasted with the welfare improvement due to better environmental conditions enabled by green employment in order to better quantify the overall social costs and benefits of green employment. However, a full-fledged cost benefit analysis, based on a soundly theoretical framework, is required to answer these questions. These and other promising avenues are left for future research.
- This blog post first appeared at LSE Business Review and is based on the authors’ paper Measures, drivers and effects of green employment: evidence from US local labor markets, 2006–2014, Journal of Economic Geography, July 2018.
- Featured image credit: Photo by Linh Do, under a CC-BY-2.0 licence
Please read our comments policy before commenting
Note: This article gives the views of the author, and not the position of USAPP– American Politics and Policy, nor of the London School of Economics.
Shortened URL for this post: http://bit.ly/2yrmNwL
About the authors
Francesco Vona – OFCE
Francesco Vona is a researcher at the Observatoire Français des Conjonctures Économiques (OFCE) and adjunct professor at SciencesPo. He’s currently working at the intersection of environmental and labour economics in a series of empirical papers on the labour market impacts of environmental regulation, with particular focus on changes in workforce skills, deindustrialization, green employment and the green job multiplier. As labour economist, he tries to disentangle the labour market impacts of family background at different stages of the working career and for different levels of ability. He’s also working on empirical tests of routine-biased technical change. As an environmental economist, he studies the effectiveness of environmental policies on innovation depending on the degree of market competition. Finally, he’s interested in the effects of inequality on economic and environmental performance.
Giovanni Marin – University of Urbino, Italy
Giovanni Marin is assistant professor of applied economics at the department of economics, society, politics, University of Urbino, Italy, a research affiliate at SEEDS (Sustainability, Environmental Economics and Dynamics Studies), Ferrara, Italy, a council member of the IAERE (Italian Association of Environmental and Resource Economists) for 2016-2019, and an associate editor of Environment, Development and Sustainability.
Davide Consoli – INGENIO
Davide Consoli is a research fellow of the National Council of Scientific Research based at the institute INGENIO (CSIC-UPV) in Valencia. He is an economist by training (MA, PhD Economics – University of Manchester) with research interests at the intersection between economics of innovation and studies on technology policy. His research focuses on the analysis of the sources and the effects of innovation across various empirical contexts including retail banking, medicine, knowledge-intensive business services, and more recently environmental sustainability.


If green jobs are that highly skilled, few Americans will qualify for them.