 Although COVID-19 has affected the entire United States, a careful look at the data shows persistent differences across the country. As with other infectious diseases, COVID-19 has thrived in the densest areas. Locations with more vulnerable populations have also suffered disproportionately. How the disease has spread across the US has had important political consequences. Klaus Desmet and Romain Wacziarg write that the initially smaller impact of COVID-19 in Republican-leaning counties may have led to laxer attitudes towards the disease, contributing to more dire outcomes in those areas over the longer run: Republican voting counties have had a higher number of deaths compared to those which voted differently.
The rapid spread of COVID-19 across the Unites States has led to a sense that no location would be spared. Early in the pandemic, in the spring of 2020, the large urban centers of the East Coast were badly hit. At the time, the more remote parts of the country still felt safe. But as the summer turned into fall, some of the most rural and isolated states in the US, such as the Dakotas, saw record numbers of COVID-19 cases and deaths. With no part of the US seemingly safe from the virus, New York Governor Andrew Cuomo’s words of the end of March 2020 took on a prescient tone: “Look at us today (…) We are your future (…) New York is the canary in the coal mine.”
Was everywhere in the country equally vulnerable to the effects of COVID-19? To what extent do the characteristics of different locations continue to affect the severity of COVID-19 today? In new research we use US county data to examine a broad set of potential explanations for disease severity, ranging from population density and poverty, to racial composition and age. We analyze the role of these potential determinants over time, starting on March 15, 2020, and ending on November 30, 2020. The time dimension is essential: what might have looked like a source of susceptibility in the early spring could very well have ceased to play a role by the late fall.
Density and other vulnerabilities
Nearly 700 years ago, The Black Death wreaked havoc in Europe’s medieval cities. Infectious diseases thrive on density. It is no different with COVID-19: notwithstanding the example of the Dakotas, density remains an important and persistent determinant of COVID-19 cases and deaths.
Identifying this persistent effect requires getting realistic measures of the effective density experienced in a person’s daily life. Simply dividing county population by county area won’t do, as it would vastly underestimate the relevant density in certain large counties, such as Clark County, Nevada, where most of the population is clustered in one city, Las Vegas. Instead, we use high-resolution data of where people live within counties to get a realistic measure of effective density: a resident of Clark County is likely to live in a location that is much denser than the county overall. We found that, just as in earlier pandemics, density worsens outcomes. Its effect is quantitatively important and shows no sign of weakening: our results indicate that a doubling of density leads to an increase in cumulative COVID-19 cases by one fifth.
In addition to this high-resolution measure of density, we further explore the importance of density by looking at people’s living arrangements (whether they live in multi-unit housing versus in single family homes) and their commuting patterns (public transit versus private vehicle), finding that these factors are predictive of disease severity. This reinforces the basic message that COVID-19 behaves as any other infectious disease: it thrives where humans cluster together.
Density is not the only vulnerability factor. Counties with more nursing home residents, lower income, higher poverty rates, and a greater presence of African Americans and Hispanics have been disproportionately impacted by COVID-19, and these effects have shown no effect of abating. We found particularly strong and persistent effects of a county’s ethnic make-up, highlighting recent concerns that minority populations are disproportionately impacted by the pandemic. Similar results hold for other indicators of socio-economic vulnerability, such as poverty.
How the pandemic spread and how people adapted
In spite of the persistence of many of the local drivers of COVID-19, not all of the determinants that seemed important in the spring survived into the fall. Proximity to major international airports was a major predictor of disease severity early on, but its explanatory power died out over time. This reveals a sequencing pattern: the virus initially appeared in locations that are well connected with the rest of the world, and then spread to the rest of the country.
Perhaps more surprisingly, counties with a high proportion of elderly experienced more deaths early on, but later in the pandemic this pattern reversed. One possible explanation for this pattern is that the more at-risk population adjusted its behavior to such an extent that counties with a large proportion of elderly individuals ended up seeing fewer cumulative cases and deaths from COVID-19. This does not apply to nursing homes, which have been powder kegs since the beginning of the pandemic.

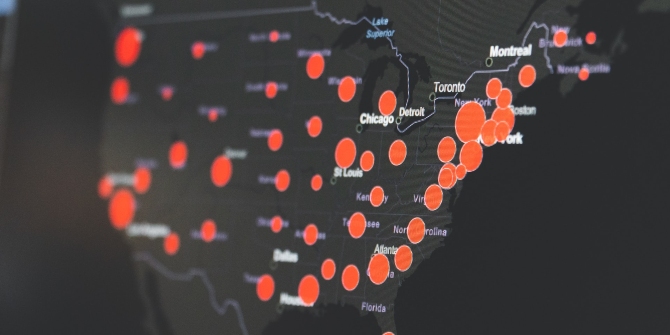
Photo by Martin Sanchez on Unsplash
Voting patterns and the geographic spread of COVID-19
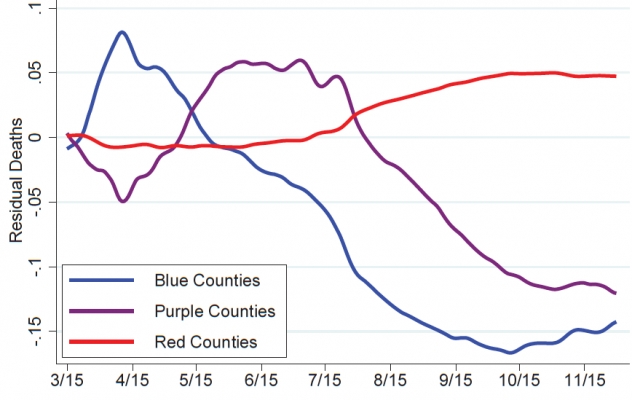
These spatial patterns in the spread of COVID-19 had important implications for US politics. We showed this by analyzing whether counties with varying political leanings experienced different COVID-19 severity. The patterns we found were interesting and told a consistent story. Early on, Trump-leaning counties were less severely affected by the disease. As time progressed, however, there was a reversal: starting in the spring of 2020, Republican counties experienced a higher number of deaths compared to ‘blue’ and ‘purple’ counties (Figure 1).
Figure 1- Cumulative COVID-19 deaths in blue, purple and red counties

Note: Blue counties are those with less than 45% Trump vote in 2016), purple counties are those with between 45% and 55% Trump vote in 2016 and red counties are those with more than 55% Trump vote in 2016. It indicates red counties faring better than blue counties early on in the pandemic but suffering a large penalty later on. The lines were obtained by holding fixed other factors that affected the severity of the pandemic, many of which we described above.
How can we make sense of this reversal? In America’s polarized political context, the response to COVID-19 has been highly politicized. Early in the pandemic, locations that were less severely affected developed habits, attitudes and preferences that made people less keen on wearing masks, social distancing, and lockdowns. When the pandemic eventually spread to these locations, politicians and the general population may have been relatively unwilling to deal with the pandemic by adopting policies and behaviors that could slow its spread. In sum, our interpretation of the reversal is that Republican-voting counties acquired lax attitudes toward mask-wearing and lockdown measures when COVID-19 was less severe in their areas, leaving them unwilling to respond more decisively when the pandemic caught up with them over the late spring and summer of 2020.
Why COVID-19 severity has varied across the US
Circling back to our initial question, are all locations in the US converging to similar degrees of COVID-19 severity? No. Our research has highlighted strong and persistent factors associated with counties’ vulnerability to the disease. First, density matters – as long as it is properly measured. Second, vulnerabilities such as a high share of minorities and poor people, persistently predict a more severe impact of the disease. Finally, COVID-19 severity is politically patterned: in the second half of 2020, Republican-leaning counties started to experience significantly higher COVID-19 deaths. These results help make sense of the pronounced and persistent geographic differences in disease prevalence that are observed across the United States.
- This article is based on the paper, “Understanding the Spatial Variation in COVID-19 across the United States” in the Journal of Urban Economics: Insights.
Please read our comments policy before commenting
Note: This article gives the views of the author, and not the position of USAPP– American Politics and Policy, nor of the London School of Economics.
Shortened URL for this post: https://bit.ly/2PlXbgv
About the authors
 Klaus Desmet – Southern Methodist University
Klaus Desmet is the Altshuler Professor of Cities, Regions and Globalization at Southern Methodist University, Research Fellow at CEPR and Research Associate at NBER. His research focuses on regional economics, economic growth, political economy and international trade. His work has appeared in journals such as the American Economic Review, the Journal of Political Economy, the Journal of Economic Theory and the Journal of Development Economics. In 2019 he was the co-recipient of the Robert E. Lucas Jr. Prize.
 Romain Wacziarg – UCLA Anderson School of Management
Romain Wacziarg is Professor of Economics and the Hans Hufschmid Chair at the UCLA Anderson School of Management. His research on the roots of economic prosperity has been published in leading academic journals such as the Quarterly Journal of Economics, the American Economic Review, the Review of Economics and Statistics, the Economic Journal, the Journal of International Economics, the Journal of Development Economics and the Journal of Economic Growth. He was the Edward Teller National Fellow at the Hoover Institution in 2002-2003.


Seems odd you measured during exactly the same time periods when your initial data suggests the curves would appear at different times. Why is that?
Showing the data plotted against the same time scale is the evidence for saying that the curves appeared at different times.
Plotting the data on the same timeline is the process by which it is observed that the curves appear at different times. There would be no other way to support that assertion.
Plotting on different timelines such as “time since 100th case” serves a different purpose, such as judging how well different responses worked.