In Kenya and Uganda, where party affiliations are often rooted in ethnic divisions, the government’s perceived ethnic favouritism is thought to translate into public employment opportunities. LSE’s Rebecca Simson looks at the evidence, and argues that ethnic inequalities in access to public sector jobs are not as large as popular perceptions might suggest.
That ethnicity matters to politics in Africa is hard to dispute, given that party affiliations in so many countries are shaped by ethnic divisions. Many argue that ethnic voting is economically rational, because benefits like jobs, schooling opportunities, infrastructure and other public goods will primarily benefit the ethnic kin of the leader in power. These perceptions of ethnic favouritism and discrimination run particularly strong in countries like Kenya and Uganda, where ethnic fissures are deep and long-standing. The Afrobarometer opinion poll (2016/18) suggests that 55% of Kenyans and 39% of Ugandans feel that their ethnic group is sometimes, often or always treated unfairly by the government.
But are these perceptions of ethnic favouritism always right? Given findings in behavioural economics, which have shown that humans are poor at accurately gauging statistics from our surroundings, should public perception be trusted on these matters? Does the average, politically-unconnected person on the streets of Nairobi or Kampala receive material benefits when their ethnic kin control the presidency or, conversely, suffer discrimination when a different ethnic coalition holds the presidency?
In a recent paper I investigate one commonly-expressed grievance in East Africa, that public sector jobs are allocated on an ethnic group basis. That high-level appointments should mirror the ruling party composition is hardly surprising, given that these posts are by design discretionarily allocated by the President (for evidence of this see Lindemann and Bangura). But does the broader civil service, the hundreds of thousands of people employed as teachers, nurses, drivers, secretaries and security guards tend to be overstaffed by the ethnic kin of the president?
Using the most recent available census microdata from Kenya and Uganda, made available by IPUMS International, I explore this question. In the Kenyan case I used a sample of the 2009 housing and population census, which identifies employees in the public sector. While self-reported ethnic identity is not included in the census sample, place of birth in Kenya is a strong proxy for ethnic identity, and respondents can therefore be classified in accordance with the dominant ethnic group in their region of birth (in multi-ethnic regions where no ethnic group constitutes above 50% of the population such as Nairobi, the region is classified as ‘mixed’). The Ugandan 2002 census, in contrast, contains a variable on self-reported ethnicity.
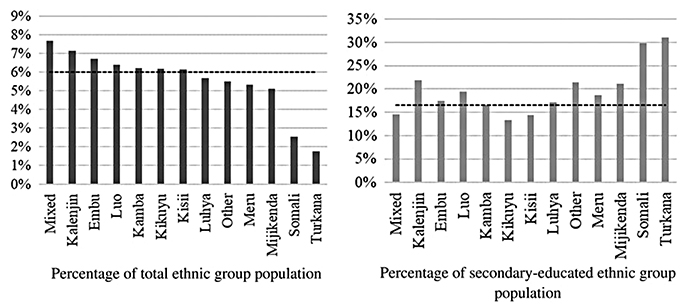
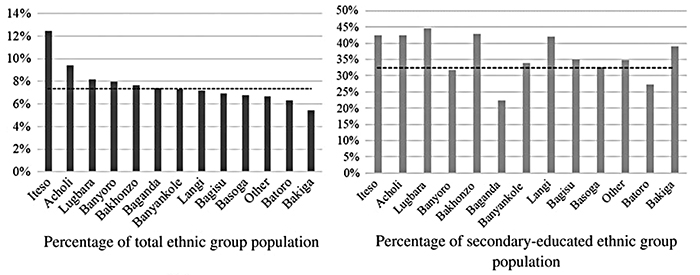
Once assembled, this evidence shows surprisingly little evidence of ethnic favouritism, and certainly not of a magnitude that would bear much material significance for the Kenyan or Ugandan populations at large. The left hand charts in figures 1 and 2 below show the proportion of the labour force, aged 25–55, employed in the public sector by ethnic category, in Kenya and Uganda. On average roughly 6% of the Kenyan and 7% of the Ugandan labour force worked in the public sector at the time of each respective census.
If presidents targeted public sector jobs towards their own ethnic kin, we should expect unusually high levels of public employment among the Kikuyu people of Kenya (co-ethnics of the then-President Kibaki, in office from 2002-13), and possibly the Kalenjin, on account of his predecessor, President Moi (1978–2002). In Uganda we would expect preference for the Banyankole (co-ethnics of President Museveni, who has led Uganda since 1986), and possibly the Langi, if the legacy of President Obote’s hiring decisions (1980–85) still influenced the ethnic composition of the civil service.
These figures show that in three of the cases of co-ethnics of past or present presidents, the Kikuyu in Kenya and the Banyankole and Langi in Uganda, these groups are not overrepresented in public employment. Rather, they have public employment levels roughly at the national mean. The Kalenjin in Kenya are the exception, which are slightly overrepresented. This may reflect an employment advantage bestowed under President Moi, but it would not display an enormous bias.


In both Kenya and Uganda, there is a cluster of larger ethnic groups that have comparatively similar public employment levels, close to the national mean indicated by the dotted line. In Kenya the Kalenjin, Embu, Luo, Kamba, Kikuyu, Kisii, Luhya, Meru and Mijikenda have between 7% and 5% of their labour forces workers engaged in the public sector, which is not a particularly large range. In Uganda the Lugbara, Banyoro, Bakhonzo, Baganda, Banyankole, Langi, Bagisu, Basoga and Batoro all lie between 6% and 8%.
As the public sector labour force is a comparatively educated strata of the total labour force, the right hand charts in figures 1 and 2 introduce a simple control for education, limiting the sample to people with four years of secondary schooling. In the Kenyan case it seems that education explains some of the ethnic group variation in public sector employment. The Somali and Turkana are under-represented in the public service but, relative to their education levels, they send an above average share of their secondary-educated members into the public sector. Conversely, in both countries the ethnic groups with the highest educational attainment, the Kikuyu in Kenya and Baganda in Uganda, contribute the lowest share of their secondary-educated members to the public sector. In other words, they are underrepresented, conditional on their educational attainment.
This descriptive evidence does not categorically prove that there is no discrimination or favouritism in public sector hiring. It could also be the case that we are omitting variables that influence hiring decisions, and that we would find evidence of bias if all the drivers of a person’s likelihood of holding a job were factored into the equation.
However, from the perspective of the Kenyan or Ugandan public, it is presumably the raw ethnic shares that matter the most. People are more likely to notice large skews in ethnic proportionality, more so than outcomes conditioned on more opaque factors like education. Interestingly, the fiercest ethnic fault lines in Kenyan politics, between the Kikuyu (incumbents) and Luo (opposition), does not seem to translate into lower public employment opportunities for people from opposition regions. The same holds true for Uganda, if we consider the political north-south divide.
As a thought experiment, we can calculate what share of the labour force would stand to gain if jobs were distributed equally across the ethnic groupings that underlie this analysis. I find that in both Kenya and Uganda, roughly 6% of jobs would need to be reallocated from over- to under-represented groups to achieve perfect ethnic parity. This represents less than half a percent of the labour force. For the average citizen, then, opportunities to work in the public sector are low in any condition, and ethnic group differences make a small absolute difference to an individual’s likelihood of gaining such a job. It seems unlikely, therefore, that improving the ethnic distribution of public employment will do much to dispel popular grievances.
Photo: meaduva, Flickr


Hi Rebecca, good work but you need better data. For instance, anyone from Uganda will obviously see that your data on Percentage of Ethnic Group in Uganda (fig.2) is wrong. Unless I am reading your data incorrectly, the Iteso are not the largest percentage ethnic group in public sector Uganda, at least anecdotally.
Also, note that the public perception of the ethnic bias in public jobs is not on the rank and file employees who seem to dominate your data, and who are grandfathered from regime to regime because of civil service protections. The presidents appoint decision making personnel [people who control the money], therefore, your study should control for the layering or stratification of this data by ranks, e.g by top 3 positions. Also consider to look at parastatal bodies where civil service rules are not very applicable. I guess your outcome might be different. Note that I also acknowledge your acknowledgement that missing variables could lead to different conclusions. Besides data problems, I think you are doing a good job.
Her research is flawed by the fact that she’s measuring what percentage of the ethnic groups are employed as opposed to what % of the labour force is filled by the different tribes. There are only a finite amount of jobs so it makes no sense to look at it from a population perspective. E.g. If there are 100 jobs available, Bagandas should fill 26.6% of those positions. I’m surprised someone from LSE could make such a blatant error.
What this shows is that the feeling that hiring in public sector jobs is skewed to favor ethnic groups is more out of perception. It’s mostly driven by isolated newspaper stories that are either quoting isolated cases in certain departments or using narrow samples to drive a popular narrative.