Previous research suggests that citizens located on the extremes of the left-right ideological spectrum are more likely to oppose European integration. Drawing on a new study, Dimiter Toshkov illustrates that when citizens are placed in a multidimensional political space, the relationship between Euroscepticism and other dimensions varies in more complex ways.
Euroscepticism is a malaise of the extreme right and the extreme left. Citizens with moderate political ideologies tend to support European integration, while those on the fringes do not. Euroscepticism goes hand in hand with (social) conservative political attitudes, such as restricting immigration and limiting gay rights. Such statements capture much of the received wisdom about how preferences for European integration should relate to the more general views citizens hold about politics and public policy. But is the received wisdom still relevant?
In a new study, we take a fresh look at the received wisdom, and we find a much more complex picture. The way preferences for European integration relate to other dimensions of political ideology differs depending on the country studied and on the way we measure preferences and ideology. Moreover, Euroscepticism is not just another aspect of social conservatism. Finally, people’s attitudes towards the EU and its policies do not form a single consistent package. Let’s unpack these results and explain their significance.
For our analyses, we employ data from voting advice applications (VAA) – the online tools you use to express preferences on 30 or so policy questions, choose positions on dimensions of political ideology (such as left-right or conservatism-liberalism) and get a ‘match’ with the political parties that come closest to your preference profile. We analyse VAA data for the Netherlands, Germany, Italy and France from the period before the 2019 elections for the European Parliament.
The advantage of this data is that tens of thousands of people filled in the VAAs, so we have a lot of records. This allows us to build a high-dimensional picture of the political space in each country at great resolution and with good coverage even of the fringe corners of that space. This is not typically possible with standard surveys of public opinion. The disadvantage of VAA data is that the people using it are not a representative sample of the country’s population, so we don’t know how the results from the VAA users would generalise. We return to this limitation at the end of this post.
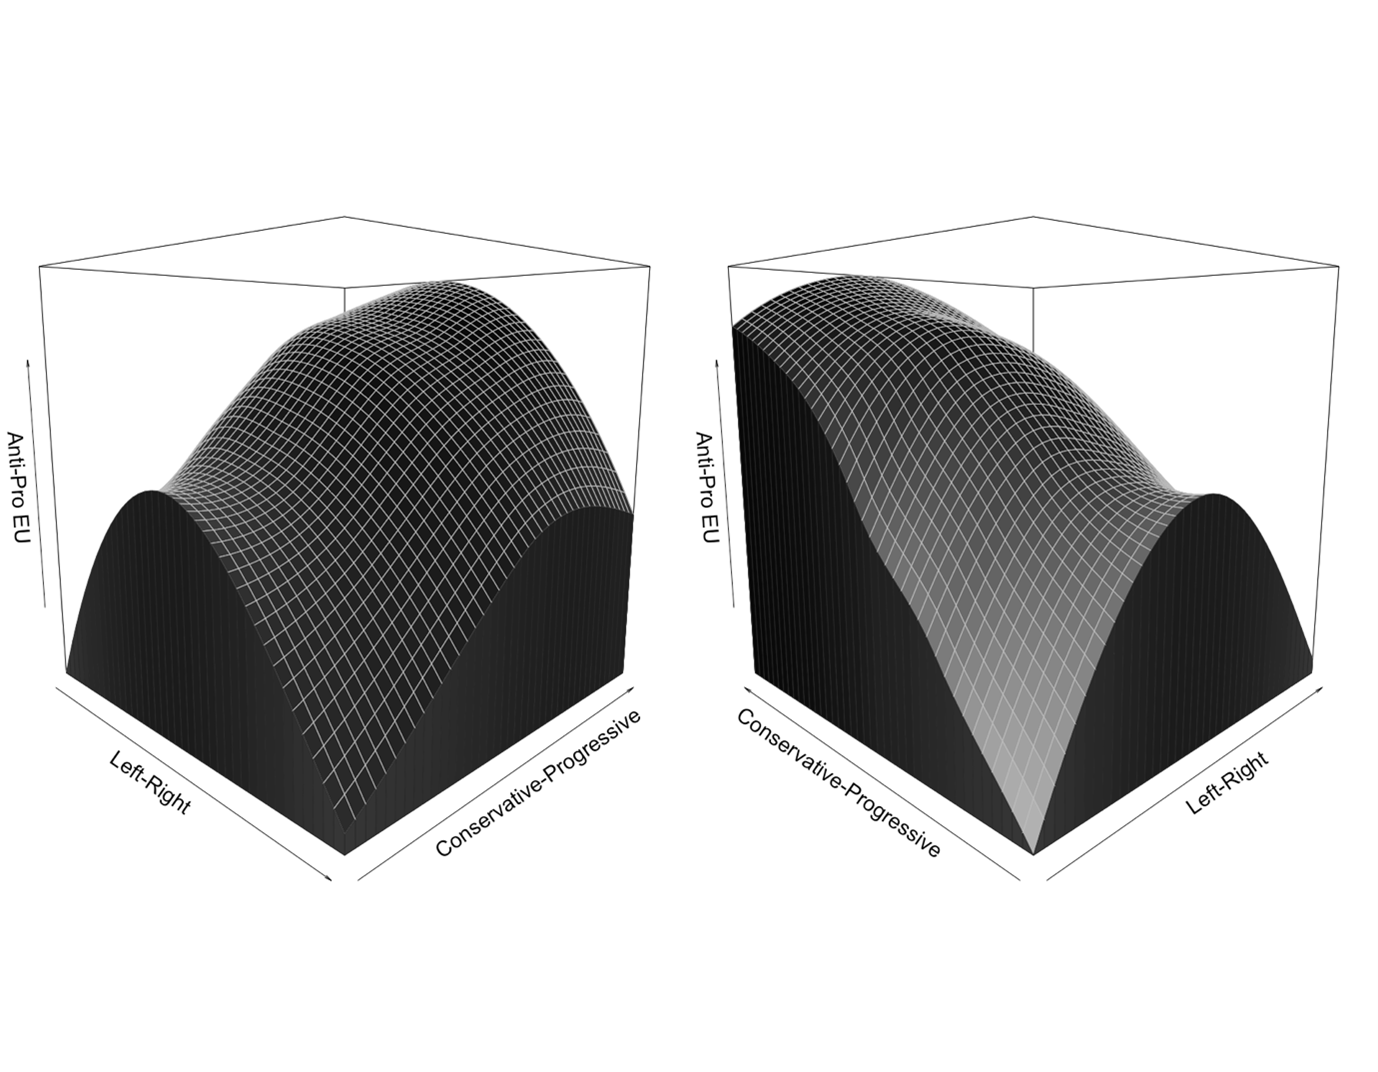
Let’s look first at how support for the EU varies with positions on the left-right and liberal-conservative dimensions of political ideology. Imagine that these two dimensions define a grid and each citizen is placed on this grid based on their scores (e.g. a ‘4’ on the left-right and a ‘6’ on the liberal-conservative dimension). Now, we can calculate the average value of EU support for all citizens located at each point of this two-dimensional space. When we plot these average values of EU support on the vertical axis, we get something like the picture in Figure 1, which shows how EU support varies for all combinations of left-right and conservative-liberal positions in the Netherlands, as of 2019 (the two panels show different rotations of the same 3D plot). As you can see, the resulting surface is quite complex!
Figure 1: The Dutch political landscape based on citizen positions on three dimensions of political ideology (2019)

Note: For more information, see the author’s accompanying paper (co-authored with André Krouwel) in European Union Politics.
It turns out that for social conservatives, EU support declines all the way as we move from the socio-economic left to the right. But for social progressives, the peak of EU support is reached at moderate, and not quite extreme left positions. For left-wingers, EU support rises only slowly as we move from the conservative to the progressive corner. But for right-wingers, the rise is steeper, and the highest point is reached before the extreme progressive end of the scale. We can take the metaphor of three-dimensional political space further and plot the same data as a true landscape using appropriate shading and colouring. Figure 2 illustrates this – the figure can also be viewed as an animated GIF here.
Figure 2: Another view of the Dutch political landscape depicted in Figure 1
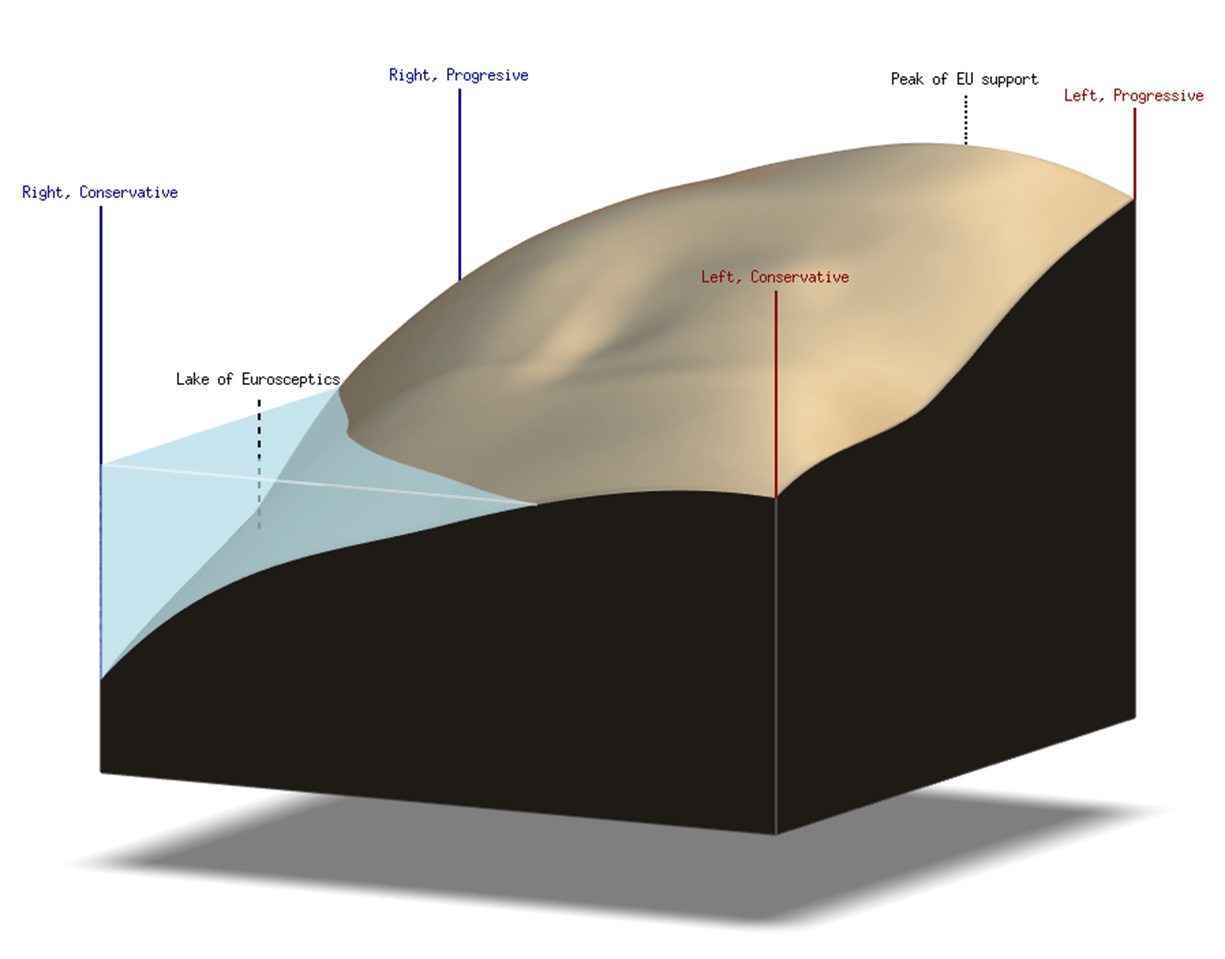
Note: For more information, see the author’s accompanying paper (co-authored with André Krouwel) in European Union Politics.
Importantly, the political landscapes we find around Europe are quite different. Figure 3 shows the Italian one, for example. Unlike in the Netherlands (and Germany), for social conservatives, EU support is highest at the middle of the socio-economic left-right scale.
Figure 3: The Italian political landscape based on citizen positions on three dimensions of political ideology (2019)
Note: For more information, see the author’s accompanying paper (co-authored with André Krouwel) in European Union Politics.
These pictures and analyses are based on how people position themselves on abstract dimensions of political ideology. But since we have data on the preferences of these same people concerning actual policies, we can check whether the abstract scales correspond to policy positions, e.g. on redistribution or migration. It turns out that the links between concrete preferences and abstract scales are quite weak and don’t always work in the way experts expect.
For example, preferences on socio-economic policy issues (think taxes, state intervention in the economy, worker’s rights, etc.) correlate only at 0.56 with self-placement on the socio-economic left-right scale and even higher (0.60) with self-placement on the liberal-conservative scale (in the Netherlands, the pattern is similar in Germany and Italy as well). This is very problematic for the way we study politics. It basically means that the numbers people choose on the abstract ideological scales are not highly predictive of the positions they hold on issues of public policy.
So self-placements on ideological scales and positions on policies that should relate to these scales are not very highly correlated. But why stop here? We can actually ask whether these scales are relevant at all for the way people’s ideas about politics and public policy are structured. To do so, we can analyse inductively how the policy preferences on all thirty policy questions are clustered, based on how the answers correlate with each other. When we do that (technically, we perform factor analysis with promax rotation of the polychoric correlations), the picture we get is even more complex. No less than six factors (or dimensions) are necessary to account for the structure of the preferences on the thirty questions in the Netherlands.
The most important factor captures items related to restricting immigration, limiting the rights of asylum seekers, but also opposition to a common EU unemployment scheme and financial solidarity. The second factor captures positions related to the EU polity (exiting the EU and the Eurozone, return of national borders and veto rights for member states). But the third factor groups another set of items related to Europe, such as the establishment of a common EU tax, army and foreign policy.
What is important to realise is that support for the expansion of EU competences is not bundled with the rest of the EU items, so these attitudes are to some extent independent from the positions on whether the EU is good altogether (factor 2) and support for individual policies (factor 1 and factor 4, which captures statements related to the environment). What about socio-economic left-right and social conservatism? These dimensions are recognisable in the data, but they only come in places 5 and 6 in terms of importance (explained variance) and collect a very small number of preferences around them.
As you might guess by now, these structures are different across the four countries we study. The economic left-right might be playing a bigger structuring role in France, and to some extent in Italy, than in Germany and the Netherlands. But in none of the four countries do preferences over EU policies and futures form a single dimension that can be summarised by a simple Eurosceptic-Europhile opposition.
Perhaps unsurprisingly after seventy years of European integration, people’s views on the EU are complex and to a large extent emancipated from their ideological positions on the left-right and liberal-conservative dimensions. This makes for some very interesting and quite varied political landscapes across the continent that we – as political scientists – should explore further.
A final note on the generalisability of these results for the populations of the countries we study – a concern due to the fact that people self-select into using VAAs rather than being (randomly) selected by researchers. We reweigh the data to resemble the demographic profile of the populations, and we get very similar results. We also redo the analyses on subsets of all users, and we still get very similar results.
This is not unexpected, because we are not interested in estimating the levels of support for the EU or different policies (which will likely be biased in our samples) but in the relationships between preferences (which need not be biased). It is true that VAA users tend to be younger, more highly educated and more interested in politics than the average citizen. But if the political structures we uncovered are already so complex based on the views of the highly educated and politically sophisticated, things will only get more complex when the views of the people with little political interest or knowledge are better represented.
For more information, see the author’s accompanying paper (co-authored with André Krouwel) in European Union Politics
Note: This article gives the views of the author, not the position of EUROPP – European Politics and Policy or the London School of Economics. Featured image credit: CC-BY-4.0: © European Union 2019 – Source: EP
