In recent years, trade between China and Sri Lanka has grown rapidly. N.R. Ravindra Deyshappriya outlines the significant trade imbalance that has developed as a result and highlights the potential for the island nation to export more products in which it has comparative advantage to its East Asian neighbour.
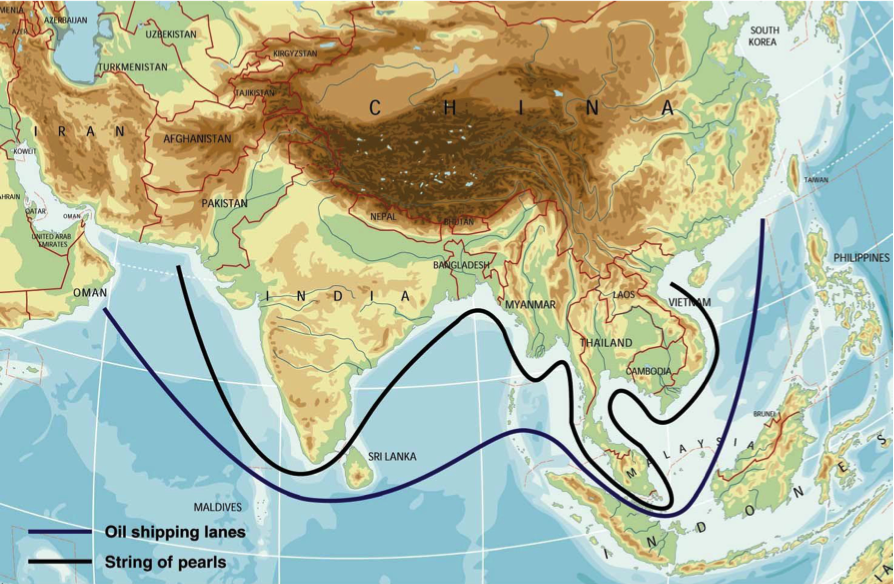
Sri Lanka’s strategic location has been a crucial factor in its engagement with other countries in the Indian Ocean Region (IOR) and with the rest of the world. As figure 1 depicts, Sri Lanka is situated between the oil shipping lane and China’s ‘String of Pearls’ (a chain of strategic maritime centres which stretches from China to the Middle East via Southeast and South Asia).
This has spurred the recent expansion of China’s trade relations with Sri Lanka, which has led to a significant trade imbalance. While Sri Lanka needs Chinese imports to grow, far more can be done to increase its exports to China. This article explains the nature of the trade imbalance, and the policy priorities for Sri Lanka to address the gap.
Figure 1: Strategic location of Sri Lanka
I. Sri Lanka’s balance of trade with China
Modern trade relations between Sri Lanka and China began with the signing of the Rubber-Rice Pact in 1952, several years before the establishment of formal diplomatic relations. Despite the continued absence of any active trade agreement, total trade between the two nations doubled in the decade 1990 to 2000, from US$ 125.6 million to US$ 256.2 million.
I.1. Imports from China
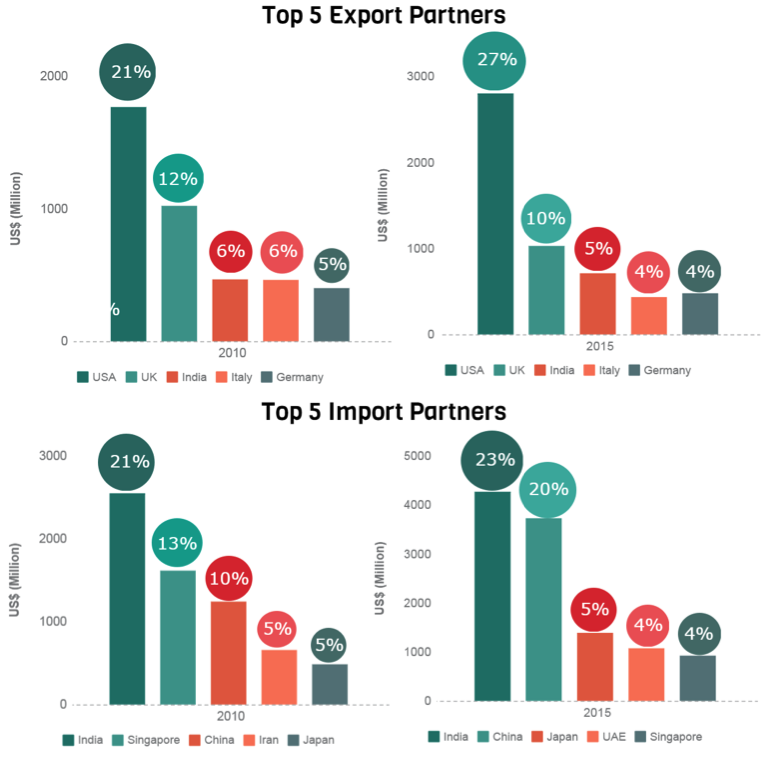
As figure 2 depicts, China had become the third largest import partner of Sri Lanka by 2010. By 2015, China’s imports to Sri Lanka were valued at US$ 3727 million in 2015, accounting for 20 per cent of total imports to Sri Lanka – only marginally below India, which accounted for 23 per cent of imports.
Figure 2: Sri Lanka’s Top Export and Import Partners (2010 and 2015)
While India remains the top source of imports, the growth rate of imports from China is far greater (except in 2014), as shown in figure 4. During the period of 2010-2014 overall growth in Indian imports was only 56.2 per cent, whereas the overall growth rate of China’s imports was 175.3 per cent.
Figure 4: Recent Trends of Sri Lanka’s Imports from Top Five Importing Partners
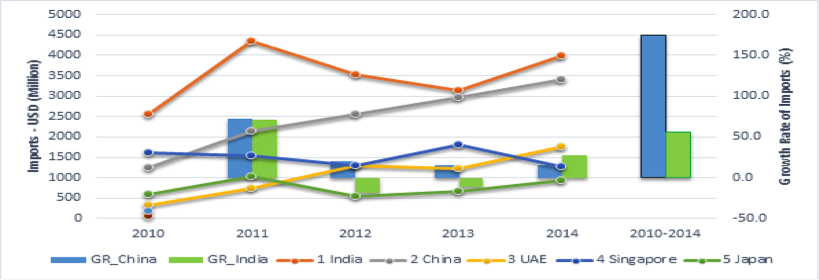
Figure 3 visualises Sri Lanka’s primary imports from China, which include semi-finished iron, light rubberised knitted fabrics, and nitrogenous fertiliser. By contrast, major exports from Sri Lanka to China, include (as the top five): special purpose ships; tea; precious stones; footwear components; and coconut and other vegetable fibres.
Figure 3: Main Imports and Exports between Sri Lanka and China

I.2. Exports to China
Compared to its significance as an import partner, China’s importance as an export destination for Sri Lanka is remarkably low. Specifically, Sri Lanka’s exports to China in 2014 were valued at only US$ 173.5 million, accounting for just 1.5 per cent of Sri Lanka’s total exports that year. Sri Lanka’s sluggish exports to China, along with the dramatic increase of imports, especially after 2000, are shown in figure 5.
Figure 5: Trade Flows and Balance of Trade between Sri Lanka and China 1985 – 2015
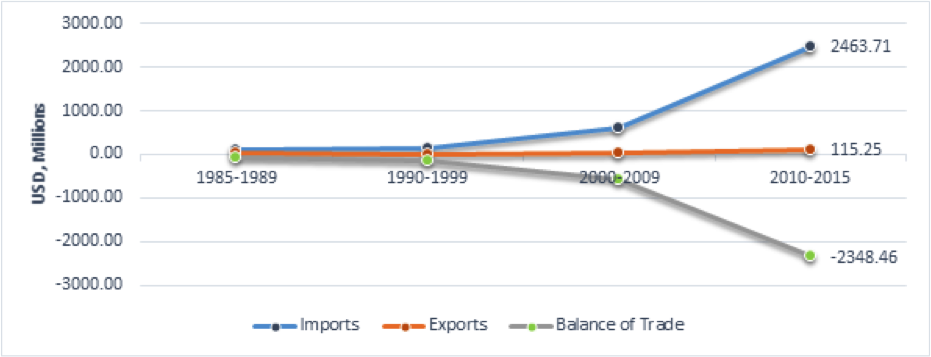
Exports to China increased 7-fold from 1985-1989 to 2010-2015, compared to an approximately 29-fold increase in imports from China in the same period. As depicted in figure 5, this has led to a starkly negative balance of trade with China, causing a deepening trade deficit during the period of 2000-2009 onwards. The trade deficit has accounted for 26.4 per cent of Sri Lanka’s total trade deficit in 2014.
However, under liberalised and globalised economic conditions, the expanding deficit should not be regarded as a major issue. Specifically, major imported products from China such as knitted and crocheted fabric of artificial filament, woven fabric of synthetic staple fibres, and dyed cotton are vital raw materials needed for the production of major local exports, particularly garments and textiles, which account for 43 per cent of Sri Lanka’s total export earnings in 2015.
In addition, imports from China include electronic products and consumer durables such as air conditioners, cameras, televisions, washing machines and mobile phones, for which Sri Lanka does not have a comparative advantage in production. The import of these products from China is therefore still crucial for Sri Lanka, and overall, trade relations between Sri Lanka and China are generally beneficial for both countries.
II. Policy priorities for more mutually beneficial trade
Despite Sri Lanka’s need for Chinese imports, more can be done to redress the imbalance of trade. Sri Lanka and China are currently negotiating to form a free trade agreement that would enable more mutually beneficial trade for both countries and offer potential to redress the trade deficit. Sri Lanka should capitalise on this initiative to focus more on export-oriented relations with China, by nurturing unexplored opportunities in the Chinese market.
The Sri Lanka Export Development Board has already recognised over 500 products in which Sri Lanka has a comparative advantage, only 24 of which are being produced domestically by China. There are 299 products on the list that are not currently exported to China. Sri Lanka therefore has great potential to increase its exporting capacity by introducing the new products highlighted in figure 06 to the Chinese market.
Figure 6: Potential Export Products to China
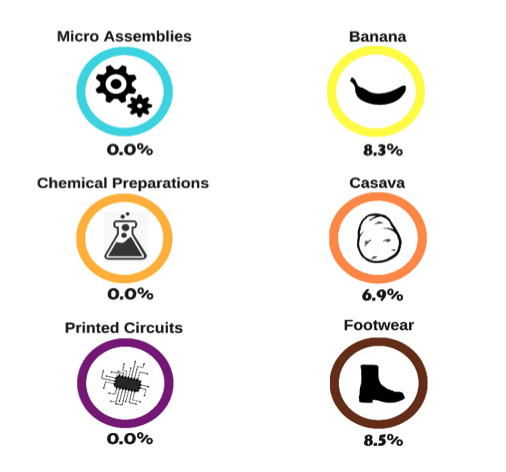
All of 299 products are currently being produced in Sri Lanka and exported to countries other than China. What is more, the first three products – printed circuits, parts of electronic integrated circuits and micro assemblies, and chemical/allied industry preparations – can be exported to China at a zero tariff rate, whilemanioc, banana, chemicals, and footwear and leather products have low tariff rates of 8.3 per cent, 6.9 per cent and 8.5 per cent respectively. Although other countries already export these products to China, there is potential for Sri Lanka to penetrate Chinese markets due to growing demand and the low tariffs applied. In this context Sri Lanka’s corporate or government representatives need only negotiate with possible buyers in China to introduce these products into Chinese markets.
In addition to the above products, Ricardo Hausmann of Harvard University’s Kennedy School of Government has noted that Sri Lanka could expand its export basket by producing medical equipment, using its comparative advantages in textile and rubber sectors. For long-term mutual benefit, however, it is necessary and therefore strongly recommended that Sri Lanka and China conclude a free trade agreement.
When considering export strategies, the government should recognise and identify the diversity of Chinese consumer preferences across cities and regions, rather than targeting the Chinese market as a whole. Sri Lanka should therefore work to establish strong city-to-city links, built on mayor-to-mayor relations, which would lead to beneficial trade relations based on the specific market requirements of Chinese cities.
Cover image: Bird’s-eye view of part of Fort and the emerging Financial City (Port City), Colombo. Credit: Dhammika Heenpella CC BY-NC 2.0
The author would like to thank colleagues at the Lakshman Kadirgamar Institute for comments on earlier versions of this article. The opinions expressed in this article are the author’s own and not the institutional views of LKI. They do not necessarily represent or reflect the position of any other institution or individual with which the author is affiliated.
About the Author
N.R. Ravindra Deyshappriya is Research Director at the Lakshman Kadirgamar Institute of International Relations and Strategic Studies (LKI).