As Sri Lanka struggles amidst economic instability and hyper-inflation, N. P. Ravindra Deyshappriya analyses official data on poverty over the last 20 years, and argues for a more nuanced re-categorisation of the poor in datasets to enable a better targeted and customised benefits system that will optimise the impact of various welfare programs, and reduce overall poverty in the country.
Poverty — being a pronounced deprivation in well-being, where well-being can be measured by an individual’s possession of income, health, nutrition, education, assets, housing, and certain rights in a society such as freedom of speech — has been recognised as one of the key indices of development, especially in developing countries like Sri Lanka. In fact, poverty has been specifically considered for global development agendas such as Millennium Development Goals (MDGs) and Sustainable Development Goals (SDGs) because to its centrality in the development agenda. While MDGs aimed to reduce the global share of extreme poverty by half between 1990–2015, the focus of SDGs is on ending poverty in all its forms by 2030. Individual countries, regional organisations and non-governmental organisations have also included reducing or ending poverty in their development programs.
Ending poverty nonetheless remains an enormous challenge for most developing countries, mainly due to unfavourable economic, political and climatic conditions. As highlighted by the World Bank, by 2018, 8.6 per cent of the global population was suffering from poverty, while sub-Saharan Africa and South Asia had 38.3 per cent and 15.3 per cent of the global poor respectively. There is clearly a high concentration of poverty in South Asia despite poverty levels varying greatly within the region.
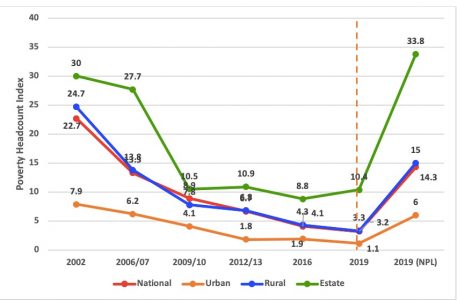
Sri Lanka has been widely appreciated for its declining poverty rates, especially through the last two decades. In addition to the poverty estimates based on the National Poverty Line, the Headcount Indices based on different internationally recognised poverty lines also confirm a steady decline in poverty in Sri Lanka between 2002–2019 (Figure 1).

Figure 1: Various Poverty Lines for Sri Lanka, 2002–2019. Source: Based on data from Department of Census & Statistics of Sri Lanka © Author.
The Headcount Index at the national level dropped from 22.7 per cent in 2002 to 3.3 per cent by 2019. However, regional poverty disparity was significantly higher as Estate and Rural sectors account for remarkably higher poverty incidence compared to the urban sector. As such, the declining trend in poverty has been very unequal across the sectors. Poverty level in the Estate sector has been significantly higher compared to both Rural and Urban sectors, even as it has been slashed from 30 per cent in 2002 to 10.4 per cent in 2019. Conversely, Headcount Index of both Urban and Rural sectors in 2019 are 1.1 per cent and 3.3 per cent respectively, highlighting the huge variation in poverty incidence across sectors. The official Poverty Line indicates the minimum monthly expenditure which requires a person to fulfil his or her basic needs at minimum level; the poverty figures in 2019 have been estimated (by the Department of Census and Statistics in Sri Lanka) considering the Poverty Line at LKR Rs 4,166.00.
*
The current economic instability and inflationary pressure in Sri Lanka has drastically increased the price of both Food and Non-Food items. Accordingly, headline inflation has increased to 64.3 per cent in August 2022, driven by the monthly increases in both Food and Non-Food categories; Food inflation has increased to 93.7 per cent in August 2022, while Non-Food inflation has increased to 50.2 per cent.
In this scenario, LKR Rs 4,166.00 is obviously not sufficient to achieve the basic needs at a minimal level. The Department of Census and Statistics has therefore re-estimated the Poverty Line by incorporating price dynamics alongside dynamics in lifestyle and consumption patterns, at LKR Rs 6,966.00 in 2022. But this re-estimated poverty line also does not capture the severity of the current inflation, though it is certainly more realistic than the earlier calculation at LKR Rs 4,166.00.
The impact of price hike on poverty incidence is apparent when poverty rates are calculated based on the re-estimated Poverty Line. As shown in Figure 1, poverty Headcount Index per the New Poverty Line (NPL) in 2019 has dramatically increased at both the national and sectoral levels: from 3.2 per cent to 14.3 per cent in the NPL. Similarly, poverty rates in Urban and Rural sectors have increased from 1.1 per cent to 6.0 per cent, and from 3.3 per cent to 15.0 per cent respectively, while the Estate sector accounts for the highest increase in poverty — from 10.4 per cent to 33.8 per cent. According to this estimation, one in every three individuals in the Estate sector is poor.
Calculations based on the NPL has increased the number of poor people from 689,900 to 3,042,300 at the national level, pushing an additional 2,352,500 people into poverty. Increase in the number of poor people is more substantial in the Rural sector where the number has increased from 548,400 to 2,500,600. This clearly highlights a marked increase in poverty incidence in Sri Lanka, following the pandemic its current economic crisis.
Recognising the Vulnerable Non-Poor
According to the Old Poverty Line (OPL; at LKR Rs 4,166.00), only 3.2 per cent (in 2019) of Sri Lanka’s population were poor while the new figure is 14.3 per cent according to the re-estimated NPL (at LKR Rs 6,966.00). However, there is a high concentration of people who are just above the poverty line. They are categorised as ‘Non-poor’ as their monthly expenditure is higher than those at or below the Poverty Line, though they may fall into poverty due to any minor shock to the system. Adverse shocks such as sudden price hikes or loss of employment lower their purchasing power, and they might not be able to spend as much. Such groups — who are just above the poverty line — are at a high risk of becoming poor, and should be considered as the ‘Vulnerable Non-poor’. Any adverse economic shock may push them back into poverty and, consequently, poverty incidence can again increase significantly. The Department of Census and Statistics data stresses that the poverty Headcount Index may increase from 3.2 per cent to 4.9 per cent, pushing a further 346,700 people into poverty, if the OPL increased by 10 per cent. Thus, extra attention should be paid to the Vulnerable Non-poor in order to avoid their falling back into poverty.
Further, conventional two-way poverty classification — ‘Poor’ and ‘Non-Poor’ — also ignores the huge disparities within each group. As discussed above, some households classified as ‘Non-Poor’ might be just above the poverty line, and might fall back into poverty due to any small shock; similarly, some of the households classified as Poor might be just below the poverty line while the rest far below the poverty line and suffering from severe poverty. Thus, it is crucial to take into account disparities within the ‘Poor’ and ‘Non-Poor’ in order to implement more realistic policies towards poverty reduction. This will entail a more nuanced identification of types of ‘Poor’, which may be as follows:
- Extreme Poor: If the household’s expenditure is less than or equal to half of official poverty line.
- Poor: If the household’s monthly expenditure lies between half of the official poverty line and the official poverty line.
- Vulnerable Non-Poor: If the household’s monthly expenditure lies between the official poverty line and 1.5 times the official poverty line.
- Non-Poor: If the household’s monthly expenditure is higher than 1.5 times the official poverty line.
This four-way categorisation of the Poor will help Sri Lanka to recognise specific groups of poverty, and to implement anti-poverty policies more effectively by focusing on the varying requirements of the differently-identified poverty categories.
Social Protection Programs and the Alleviation of Poverty
Sri Lanka has been practicing different kinds of social protection programs since her independence in 1948 and, over the years, such programs became a key component of political propaganda amongst political parties. However, these programs have not been very successful in alleviating poverty, and consequently poverty remains a development issue in Sri Lanka.
Social protection programs are recognised as political strategies which have been used to win the will of lower income group voters during elections. The current post-pandemic/economic crises situation has made them ever more essential. The International Monetary Fund (IMF) and World Bank — major investors in and lenders to Sri Lanka — have also emphasised the importance of social protection programs to facilitate the lower income groups in Sri Lanka.
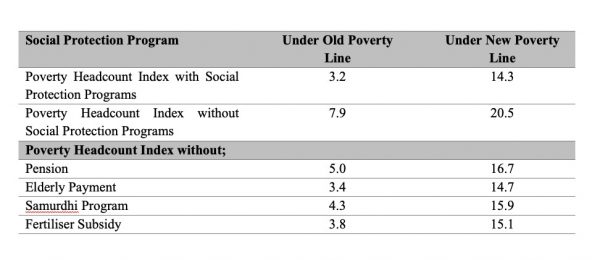
Table 1 summarises the key findings of the estimated impact of social protection programs on poverty in Sri Lanka.

Table 1: Summary of Estimated Impact of Social Protection Programs in Sri Lanka. Source: Data from the Department of Census & Statistics of Sri Lanka © Author.
According to figures in Table 1, social protection programs have reduced poverty from 7.9 per cent to 3.2 per cent under the OPL, and from 20.5 per cent to 14.3 per cent under NPL. Hence, Sri Lanka poverty figures could have potentially increased by 6.2 per cent (under NPL) in the absence of social protection programs. The positive impact of the Pension scheme on poverty is substantial, and poverty Headcount Index may have increased to 16.7 per cent without it. Apart from that, Sri Lanka poverty rates could have increased up to 15.9%, 14.7% and 15.1% under NPL in the absence of the Samurdhi Program, Elderly Payment and Fertiliser Subsidy programs respectively.
It is therefore essential to implement appropriate social protection programs in order to ensure a better living standard for lower income groups who are suffering by the multiple crises that Sri Lanka has faced in recent years, from the Easter bomb blasts of 2019 to the impact of the pandemic and the current critical economic instability.
The views expressed here are those of the author and not of the ‘South Asia @ LSE’ blog, the LSE South Asia Centre or the London School of Economics and Political Science.
Banner image © Towfiqu Barbhuiya, 2021, Unsplash.


