London’s technology ecosystem is thriving. The city has over 50,000 tech firms, with over 260,000 employees. Venture capital investment rose from £384 million in 2013 to £1.8 billion in 2018. A number of companies, such as Deepmind, Transferwise and Deliveroo, have become unicorns, valued at more than £1 billion. It survived the financial crisis and is — so far — largely Brexit-proof.
East London is an important part of this story. Since the late 1990s, the neighbourhoods around Shoreditch have become home to a rich tech community, especially digital content firms that bridge to traditional media, advertising, marketing and design. The cluster’s growth went under the radar until, in 2008, Silicon Roundabout caught the media’s attention. In late 2010, policymakers stepped in: then prime minister David Cameron launched East London Tech City, a flagship cluster-acceleration programme.
The policy mixed marketing and place branding; foreign investment; business support; network-making; tax breaks; and a one-stop delivery body, the Tech City Investment Organisation. This bottom-up, light-touch approach was unusual in trying to go with the grain of the local ecosystem, rather than reshaping the area through large-scale physical development.
The consensus is that these interventions — lauded by, among others, Boris Johnson in his time as London’s mayor — have been hugely successful. Rebranded as Tech Nation, the programme now covers the whole UK. But until now, no-one’s actually tested what happened on the ground. In a new paper, I plug that gap.
There are many reasons to care about this, even if you’re not a Londoner. First, lots of cities worldwide have tech clusters like this — Manchester, Leeds, New York, San Francisco, Stockholm, Berlin or Tel Aviv. Can they learn from London’s experience?
Second, cluster policy is contentious. Policymakers love them: but many academics are deeply sceptical of whether they achieve anything. Who’s right? It turns out that while there are hundreds of academic papers on clusters, very few actually try to evaluate the effects of cluster policies. Here is a gap we need to fill. Very simply, there are three families of cluster policy. One group involves formalised national partnerships, as used in France and Japan; a second group covers city rezoning and rebuilding, as in Barcelona’s 22@. A third group uses Michael Porter-style ‘light touch’ programmes. Tech City is in this third group.
Third, the Tech City mix is unusual in trying to ‘go with the grain’ of the local ecosystem, rather than reshaping the area through large-scale physical development, or using industry membership models. Does this bottom-up, light-touch approach work any better than previous top-down approaches?
I think of the cluster as a 1km zone around Old St roundabout: that’s how most people saw it in 2010, when the policy arrived.
Figure 1. The ‘Tech City’ area

Source: Google maps. Red circles show approximately 250 m rings around the Old Street roundabout. The cluster zone is defined as the 1 km ring from the roundabout.
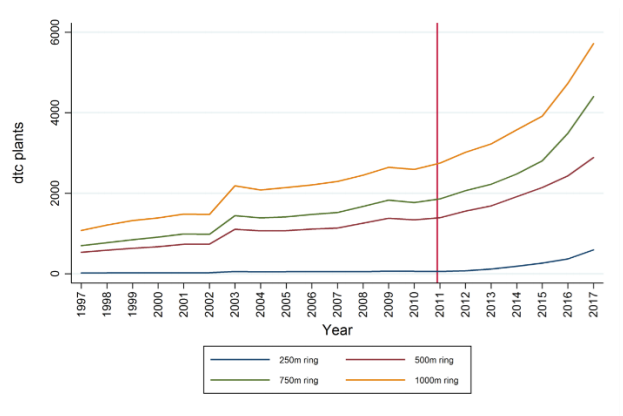
I start by looking at long-term trends in the area. Clusters are governed by positive and negative feedback loops. As they get bigger and denser, the exchange of people and ideas between firms boosts productivity. But bigger and denser also means more expense and competition. This pushes some companies out of the market or out of the neighbourhood. In Shoreditch, both positive and negative effects were in evidence — the cluster got bigger, and more expensive.
Figure 2. Tech City over time: tech firm counts vs rents
A. Tech firm counts in the Tech City zone, 1997-2017
B. Prime rents for Clerkenwell and Shoreditch submarket, 2008-2014
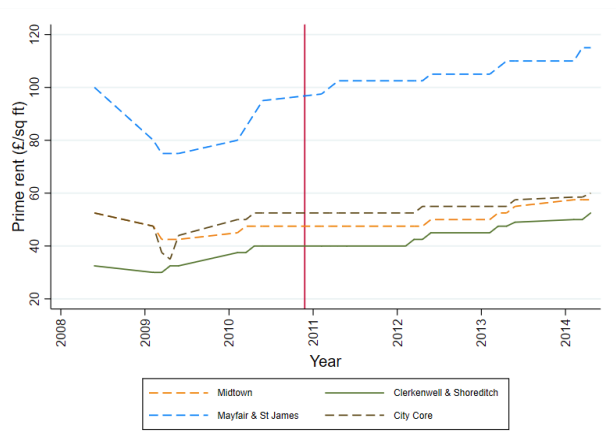
Sources: BSD, Cushman & Wakefield. Firm counts are cumulative, so area total is given by 1 km ring. Prime rents for four Inner London C&W ‘submarket geographies’, Clerkenwell and Shoreditch, Mayfair and St James, Midtown (Holborn and Temple), City Core (City of London).
Working out how much of this was down to policy interventions is especially tricky in this case. Shoreditch is an unusual neighbourhood, and it’s hard to find like-for-like comparisons elsewhere in London. So instead, I compared changes in Shoreditch to a ‘synthetic Shoreditch’, modelled using data adapted from London tech hotspots beyond Tech City. This simulated cluster looks very much like the real Shoreditch before the Tech City programme began, but after 2010 it follows its own path, in a parallel world where the policy didn’t happen.
Overall, I find that the policy increased the size and density of the cluster, both for the digital content firms and a newer wave of smaller, younger digital tech firms specialising in hardware, software and IT. But this seems not to have consistently increased firm performance, with only the established digital content firms seeing higher revenue per worker.
Figure 3. Policy effects on cluster size. Changes in Tech City tech firms vs. synthetic counterfactual
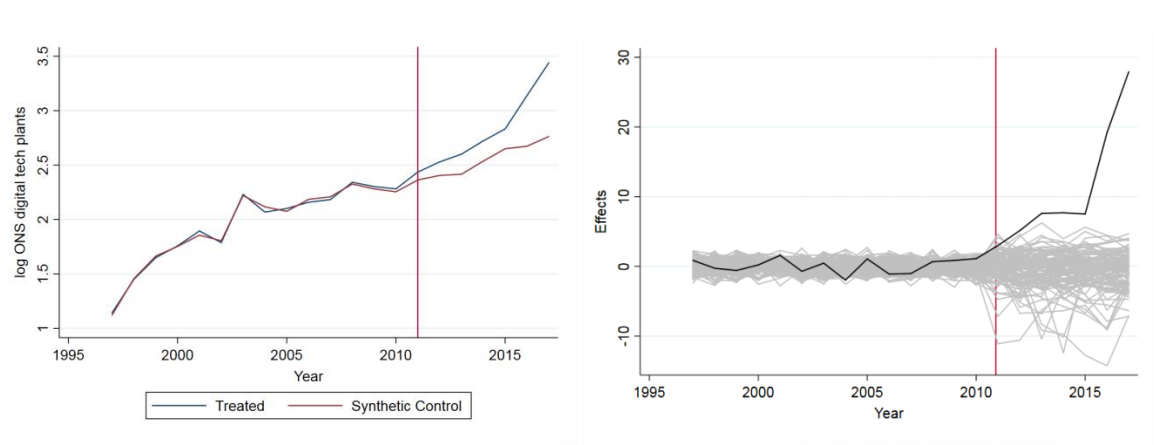
Source: BSD 1997-2017. The left column shows outcomes for Tech City LSOAs (blue) vs. synthetic Tech City (red), the no-policy counterfactual scenario. The right column shows precision-weighted effect sizes for Tech City (black) vs. 213 placebo units in the donor pool (grey). Effect sizes are weighted by pre-treatment RMSPE.
Figure 4. Policy effects on cluster density – changes in Tech City tech firm shares vs. synthetic counterfactual
Digital tech firms/all firms: treatment vs. control (L); weighted effect sizes (R)
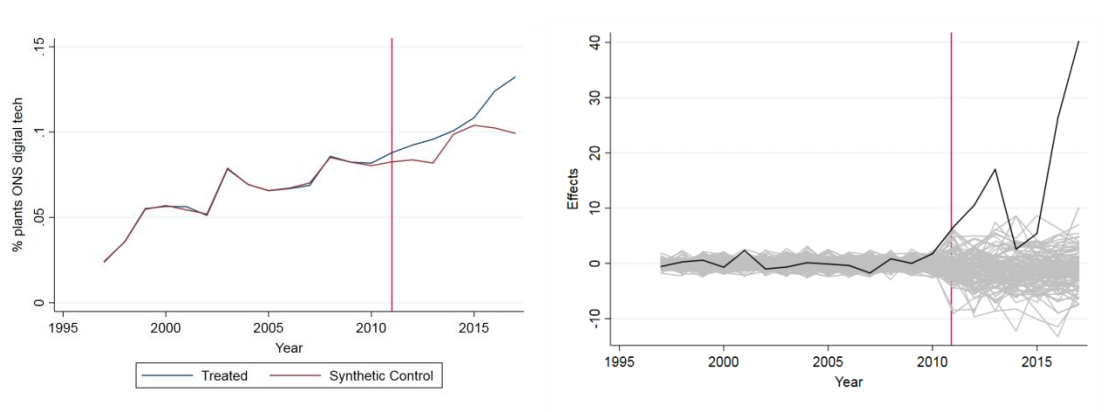
Source: BSD 1997-2017. The left column shows outcomes for Tech City LSOAs (blue) vs. synthetic Tech City (red), the no-policy counterfactual scenario. The right column shows precision-weighted effect sizes for Tech City (black) vs. 213 placebo units in the donor pool (grey). Effect sizes are weighted by pre-treatment RMSPE.
Figure 5. Policy effects on cluster ‘performance’ – changes in Tech City tech firm revenue/worker vs. synthetic counterfactual
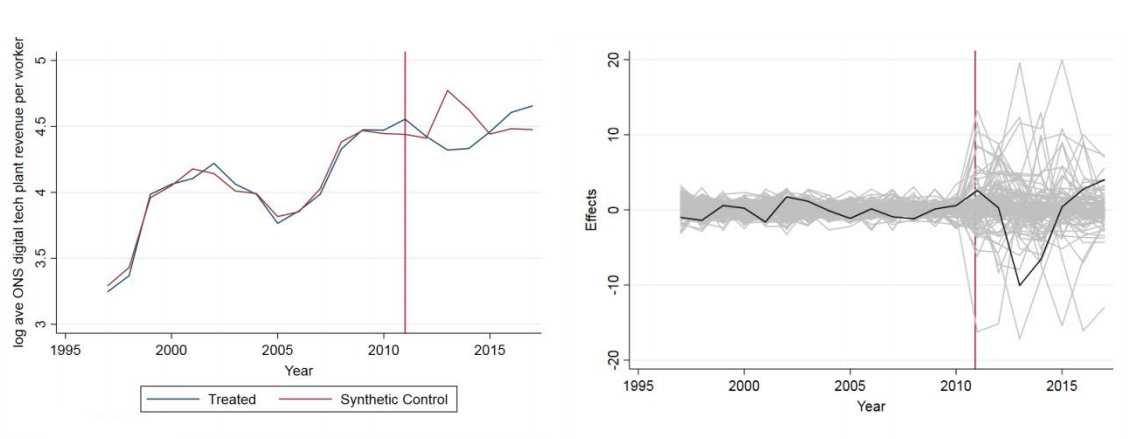
Source: BSD 1997-2017. The left column shows outcomes for Tech City LSOAs (blue) vs. synthetic Tech City (red), the no-policy counterfactual scenario. The right column shows precision-weighted effect sizes for Tech City (black) vs. 213 placebo units in the donor pool (grey). Effect sizes are weighted by pre-treatment RMSPE.
Why hasn’t a bigger, denser cluster raised performance for everyone? Cluster disruption might provide part of the answer — digital tech firms crowded into the heart of the area, and content businesses moved to its edges. Growth is also driven by new entrants, mainly UK-owned, raising levels of competition, driving down revenue per worker for the average firm.
More troublingly, I find that much of this began before 2010, when the Tech City programme began, and then weakened relative to the two years preceding it. The policy seemed to amplify the benefits of clustering for the larger, more established content firms. But for smaller, younger digital tech firms, performance fell after 2010. Here, the policy overheated the ecosystem.
So did the policy work? Sure, if a bigger cluster is all that matters. But if you also want a better cluster, the results are much more mixed, with clear winners and losers. A pessimist might say that this shows trying to steer a cluster’s course is pointless. On the other hand, Tech City shows that government can influence change without dropping huge amounts of public money.
While tradeoffs are probably inevitable, a better thought-through programme, with clear objectives linked to specific policy actions might have delivered a better balance of positives and negatives.
Light-touch approaches may work for established clusters, but are less likely to succeed in growing one from scratch. Other cities will also want to vary the policy mix, placing, say, more emphasis on infrastructure or less on branding. It’ll be fascinating to see how future policy experiments, such as London’s Med City and Manchester’s Graphene City, play out.
♣♣♣
- A version of this blog post was first published in Research Fortnight. It is based on the author’s paper Does Light Touch Cluster Policy Work? Evaluating the Tech City Programme, Discussion Paper No 1648 of LSE’s Centre for Economic Performance (CEP), August 2019.
- The post gives the views of its author(s), not the position of LSE Business Review or the London School of Economics.
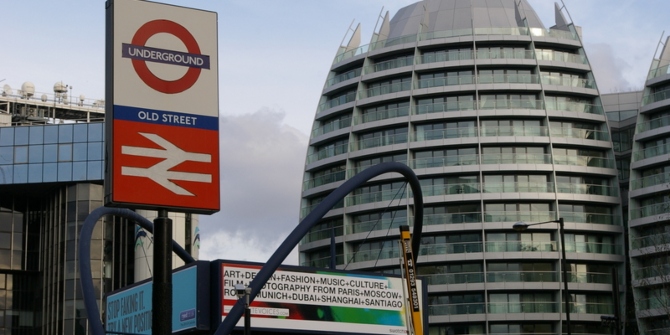
- Featured image by ogoco, under a CC-BY-NC-2.0 licence
- When you leave a comment, you’re agreeing to our Comment Policy
 Max Nathan is an associate professor in applied urban sciences at UCL, based at the Centre for Advanced Spatial Analysis (CASA). He is also a deputy director of the What Works Centre for Local Economic Growth and an affiliate at LSE’s CEP. His academic research focuses on the economics of cultural diversity, innovation systems and clusters, and in public policy for cities.


Government intervention always works. It not only brings investment but also allows opportunities for new farms. It a general rule that small farms who can do expansion have no other option than getting out of the market