The great American baseball sage, Yogi Berra, is thought to have once remarked: ‘It’s tough to make predictions, especially about the future’. That is certainly true, but thankfully the accelerating development and deployment of machine learning methodologies in recent years is making prediction easier and easier. That is good news for many sectors and activities, including microprudential regulation. In this post, we show how machine learning can be applied to help regulators. In particular, we outline our recent research that develops an early warning system of bank distress, demonstrating the improved performance of machine learning techniques relative to traditional approaches.
Why machine learning?
Roughly speaking, machine learning is a collection of techniques concerned with prediction. Think Google’s auto-complete or Amazon’s tailored product recommendations, to use a couple obvious and everyday examples.
What makes machine learning approaches so powerful relative to traditional statistical models is that they are better able to account for complexities that might be present in the data. Classical approaches, on the other hand, rely on assumptions that, while very easy to interpret and understand, are often wrong for describing the relationships in the data at hand.
Moreover, some machine learning approaches – for example, random forest and boosted decision trees – make use of techniques for combining predictive models together. It turns out that bringing together diverse and accurate models is likely to outperform a single model, even if that single model is the best on a standalone basis!
The combination of individual models is known in the machine learning jargon as ensembling and consists of three general families: bagging, boosting and stacking. These techniques have proven to be tremendously useful in making predictions less tough.
What we do
We use confidential regulatory data covering the period 2006-2012 to predict bank distress one year out, comparing and contrasting a number of machine learning techniques (random forest, boosted decision trees, K nearest neighbours, and support vector machines) with classical statistical approaches (logistic regression and random effects logistic regression).
In essence, each of the machine learning and classical techniques, in their own particular way, learn the relationship between the input and output data provided; in our case, bank financial ratios, balance sheet growth rates, and macroeconomic data for the former, and subjective supervisory assessment of firm risk for the latter.
Our aim is to choose which of these techniques is best suited for an early warning system of bank distress. We have two broad evaluation criteria: performance and transparency. Supervisors’ jobs are made easier not only from useful and accurate predictions, but also from an understanding of what is driving those predictions. For example, if it is known that a fall in a firm’s total capital ratio combined with relatively weak net interest margin is responsible for a spike in a firm’s predicted probability of distress, supervisors have a better sense of what mitigating action may be required.
What we find
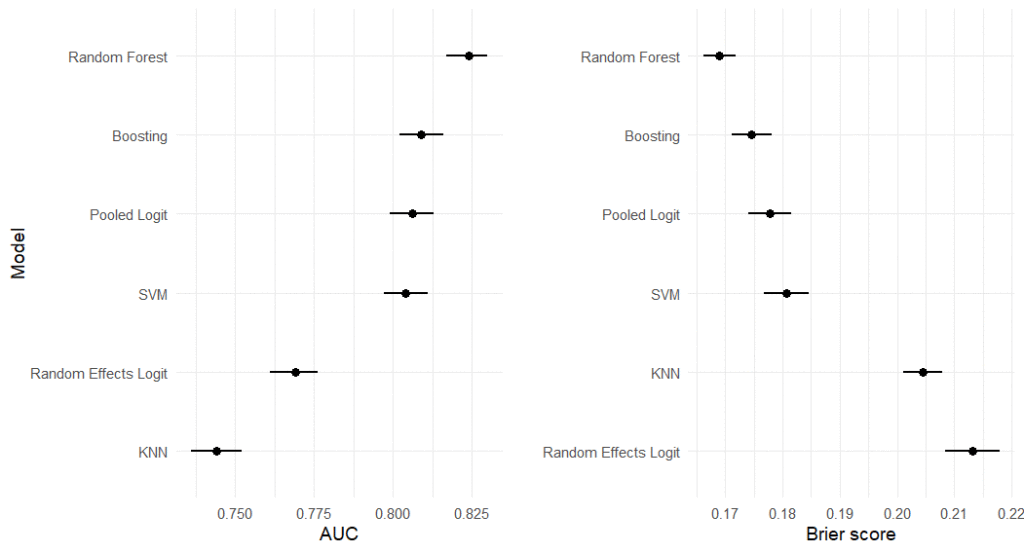
The random forest significantly and substantively outperforms the classical models and other machine learning techniques based on standard performance metrics: the AUC and Brier Score. The AUC is short for ‘area under the Receive Operating Characteristic curve‘ and measures the ranking quality of each model. The higher the AUC, the higher the probability that the model correctly discriminates between randomly drawn low and high risk firms.
The Brier score measures the quality of each model’s predictions, imposing relatively larger penalties for overconfidence when it is misplaced (ie the prediction turns out to be incorrect). The AUC and Brier results for each model are presented in Figure 1 below.
Figure 1. Performance evaluation: AUC and Brier Score

We also evaluate the performance of each model based on two different ways it could make mistakes: false negatives (missing actual cases of distress) and false positives (wrongly predicting distress) for discrete decision thresholds. From a supervisor’s perspective, false negatives are far more problematic – an early warning system that fails to set the alarm when it should, particularly for large, systemically important institutions, can have deleterious consequences. Scrutinising a flagged bank that goes on to perform better than predicted, though costly in terms of resources, poses a less serious problem. The random forest again performs best when we vary the cost of these different errors, increasing the importance we place on false negatives.
What drives distress?
Machine learning techniques tend to be opaque relative to classical models. We therefore apply state-of-the-art machine learning interpretability approaches to provide a sense of what is driving the random forest predictions.
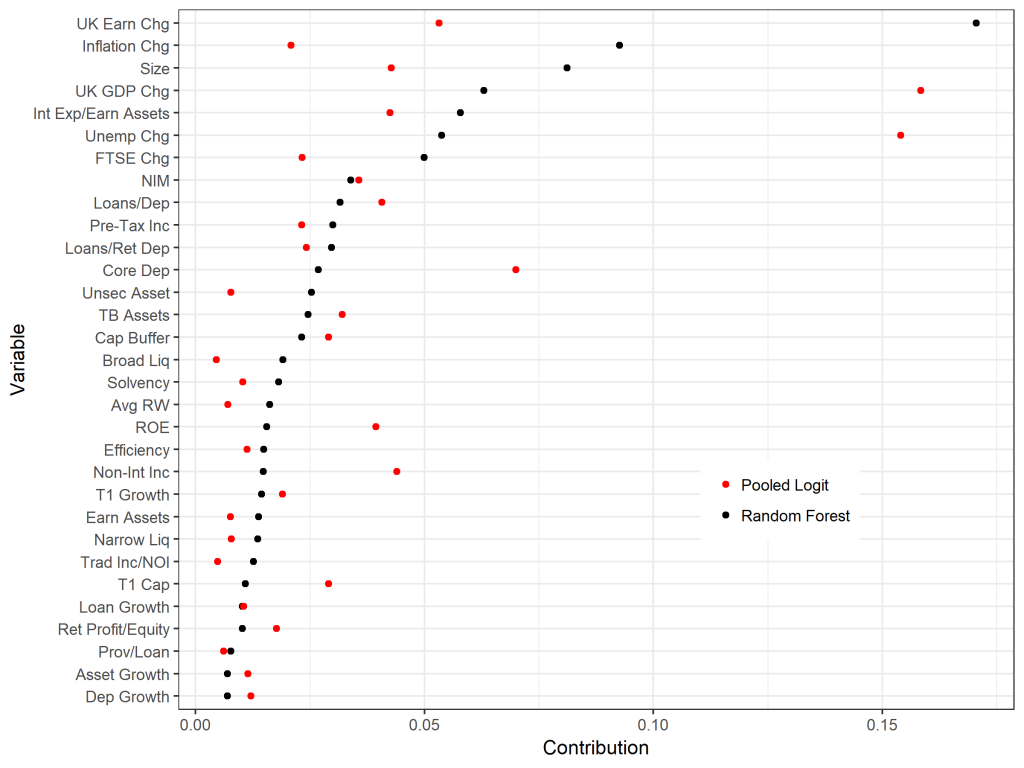
By computing Shapley values, we can tell the contribution of each input to the difference between a specific prediction and the average prediction (see here for an intuitive explanation and example). Figure 2 aggregates the Shapley values, providing the mean absolute Shapley value per input variable and comparing the random forest with the logistic regression model.
As can be seen in Figure 2, there is a substantive difference between the machine learning and classical model. A lot of this can be explained by the fact that the random forest accounts for the complexities in the data. We demonstrate this by measuring the interaction strength of each variable using what’s known as the H-statistic (defined as the share of total variance explained by a given variable’s interaction with all other variables in the model).
Figure 2. Mean absolute Shapley values for the random forest and pooled logit

Following the work of our colleague at the Bank of England, Andreas Joseph, we also conduct statistical inference with the help of the computed Shapley values, performing Shapley regression. This allows us to understand which of the input variables are significant for driving predictions, providing greater interpretability and transparency for the random forest.
What next?
Our paper makes important contributions, not least of which is practical: bank supervisors can utilise our findings to anticipate firm weaknesses and take appropriate mitigating action ahead of time.
However, the job is not done. For one, we are missing important data which is relevant for anticipating distress. For example, we haven’t included anything that speaks directly to the quality of a firm’s management and governance, nor have we included any information on organisational culture.
Moreover, our period of study only covers 2006 to 2012 – a notoriously rocky time in the banking sector. A wider swathe of data, including both good times and bad, would help us be more confident that our models will perform well in the future.
So while prediction, especially about the future, remains tough, our research demonstrates the ability and improved clarity of machine learning methodologies. Bank supervisors, armed with high-performing and transparent predictive models, are likely to be better prepared to step-in and take action to ensure the safety and soundness of the financial system.
♣♣♣
Notes:
- This blog post appeared first on the Bank of England’s blog Bank Underground. It is based on Predicting bank distress in the UK with machine learning, Bank of England’s staff working paper No. 831.
- The post expresses the views of its author(s), not the position of LSE Business Review or the London School of Economics.
- Featured image by Ali Shah Lakhani on Unsplash
- When you leave a comment, you’re agreeing to our Comment Policy
 Joel Suss is a researcher in the Bank of England’s UK Deposit Takers Division and a doctoral researcher at LSE, based in the department of psychological and behavioural science and affiliated with the LSE International Inequalities Institute and LSE Centre for the Analysis of Social Exclusion. Previously he was the managing editor of LSE British Politics and Policy. Joe is an experienced research scientist with strong quantitative and programming skills (R language). Applying experimental methods, data science, and machine learning to policy-relevant questions.
 Henry Treitel works in the Bank’s International Banks Division. He works on a team which assists the teams’ performing day-to-day supervision in various ways. His specialities are accounting, regulatory capital and regulatory reporting.


