A progressive tax system takes a larger amount from those most able to pay: someone who receives £100,000 should pay a larger share of that in tax than someone earning £10,000. A horizontally-neutral tax system takes the same amount from people with the same level of resources: two people receiving £100,000 should pay the same tax. The UK income tax system achieves neither of these.
Using anonymised administrative data on all taxpayers receiving more than £100,000 in income and/or capital gains, we study how much tax people actually pay as a share of the money they receive – their effective average tax rate (EATR) — rather than focusing on the headline rate.
Actual tax paid may differ from the headline rate for two reasons. First, money from different sources is taxed at different rates in the UK. A consultant working for a big firm earning £150,000 has to pay 47% of any additional income in tax (45% income tax, plus 2% national insurance). If s/he instead gets paid through a personal service company, and takes the money in the form of dividends, s/he pays 38.1% on every additional pound. [S/he will also pay corporation tax on profits before dividends. However, on employment income s/he (or his/her previous employer) would also have been paying employer national insurance contributions which are similar in magnitude.] Or, if s/he keeps the money in the firm until selling or liquidating the firm, s/he can receive the money as capital gains, with rates as low as 10%.
Second, taxpayers may claim various deductions and reliefs.
In practice the tax system is regressive at the top
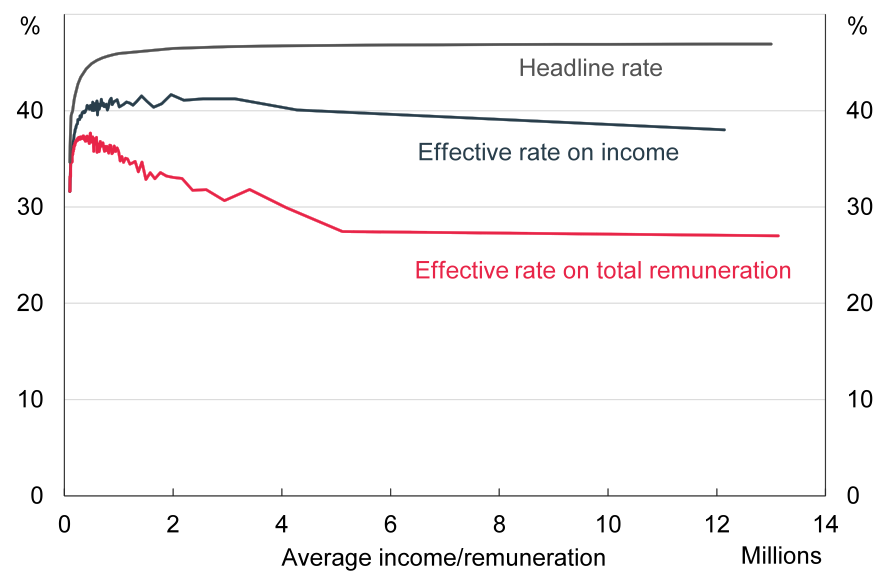
Figure 1 shows in blue, for any given level of income, what is the mean effective average tax rate of taxpayers with that level of income. The mean EATR is increasing up to £500,000, but is then flat and even declining slightly at the top. This is in contrast with the headline average tax rate – the statutory income tax rate on earnings, which applied to three-quarters of all income – which is about 4-5pp higher than the average EATR at £500,000 and continues to rise. For someone receiving £2 million the difference between headline and effective average tax rates is 7pp: a tax saving of £140,000.
Figure 1. Mean effective average tax rates on income and on total remuneration among those receiving more than £100k in income/remuneration, 2016

Notes: Constructed using data on all reported taxable income and capital gains going to individuals in 2016. “Effective rate on income” shows the EATR on income only. “Effective rate on total remuneration” shows the EATR on income plus gains. “Headline rate” shows the headline (statutory) rate on earnings. Source: Authors’ calculations based on HMRC administrative datasets.
As we explain in Advani and Summers 2020, a lot of capital gains are repackaged income. There is therefore a strong case for looking at the effective average tax rate not just on income alone, but on total remuneration: income plus capital gains. Including gains, average EATRs peak at just £250,000 before declining sharply. On average, individuals with total remuneration of £10 million had an EATR of just 21%. This is much less than half the headline rate for someone at that level of earnings; in fact, it is even less than the rate that would be paid by someone on median earnings of £30,000.
Among people with same income, amount paid varies by a factor of 5
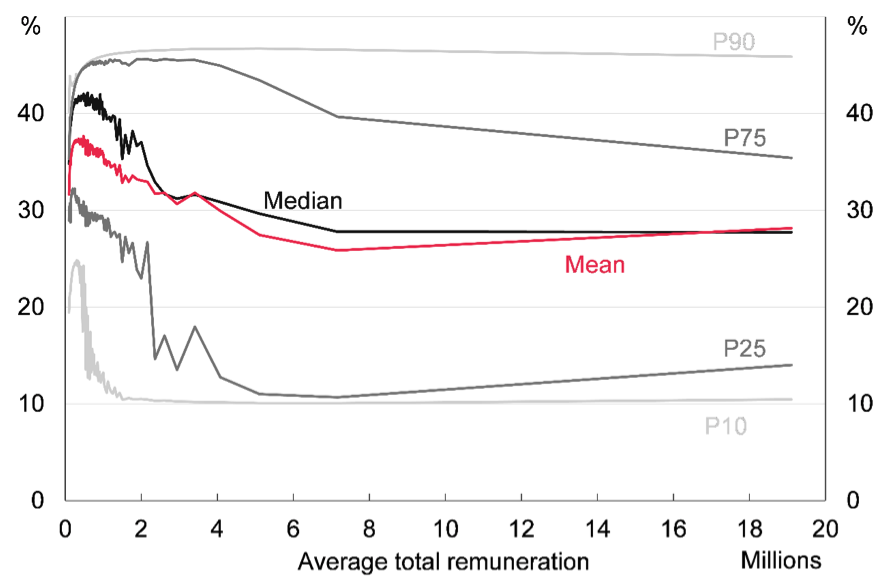
The benefit of these low rates for those with high remuneration is very unequally shared. One quarter of those with total remuneration below £2 million pay close to the headline average rate for earnings (around 45%), but at the other end of the scale one quarter have EATRs less than 30%, which is equivalent to someone earning under £60,000. Above £5 million, the proportion paying the headline rate for earnings reduces to one in ten, whilst more than half pay less than 28%. One in ten people with total remuneration over £1 million paid a lower EATR than someone earning just £15,000 (less than 11%).
Figure 2. Distribution (mean and percentiles) of effective average tax rates on total remuneration among those receiving more than £100k in remuneration, 2016

Notes: Constructed using data on all reported taxable income and capital gains going to individuals in 2016. All lines show the EATR on income plus capital gains. “Mean” shows the average (mean) EATR at different levels of remuneration (income plus gains). “Median” shows the median EATR at different levels of remuneration, and “PXX” shows the XX percentile of EATR at any given level of remuneration. Source: Authors’ calculations based on HMRC administrative datasets.
An alternative minimum tax?
It is often said that the rich already pay a lot of tax, and that it would not be possible, or fair, for them to pay more. But a substantial minority of the richest individuals in the UK actually pay very low effective average tax rates – in some cases lower even than those on modest earnings – whilst others in this group pay close to the top headline rates. These disparities are likely to strike many as unfair, both from the perspective of vertical equity between those with differing abilities to pay, and as a matter of horizontal equity amongst those at similar (high) levels of total remuneration.
There is a lot of money at stake here. A static estimate implies up to an additional £20 billion could be raised by applying the headline average tax rate on earnings to the total remunerations observed. This is approximately equivalent to raising the basic rate of income tax by 4 percentage points, or increasing both the higher rate and the additional rate by 10 percentage points each. Clearly, the actual yield will be reduced somewhat by behavioural responses. However, the scope for avoidance by shifting income across tax bases is brought down substantially in this context, where tax rates are being aligned across bases, compared with, say, raising the higher and additional rates on earnings only.
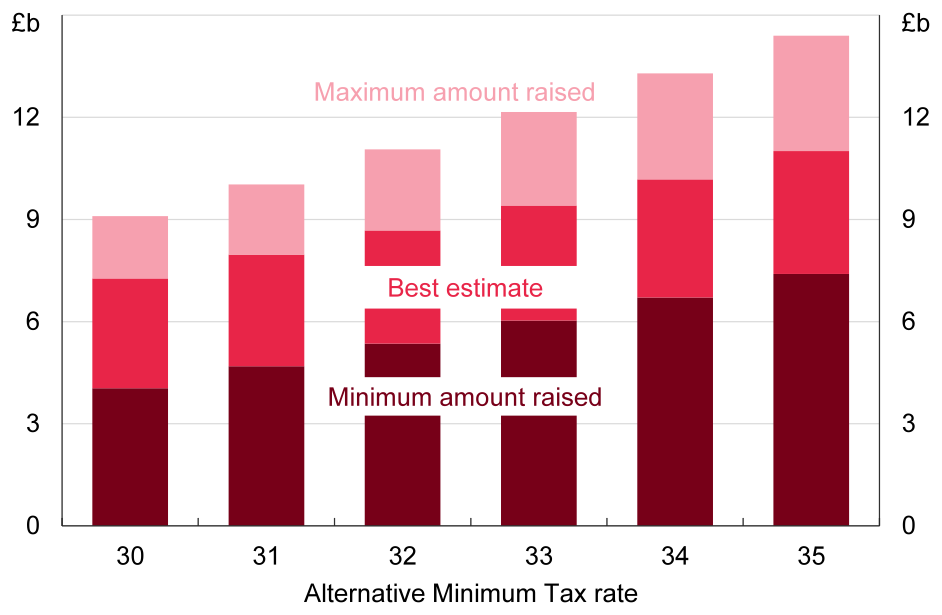
The above estimate effectively removes all deductions and reliefs apart from pensions and gift aid reliefs at the basic rate, but one might not want to go that far. A less drastic policy would be an alternative minimum tax. This would impose a minimum average tax rate for individuals with remuneration above some level. It allows individuals to benefit from particular individual deductions and reliefs, or lower rates on some kinds of remuneration, while limiting the extent to which any individual can lower their overall tax bill. An alternative minimum tax set at 35% (the same average rate as someone earning £100,000) on total remuneration could raise up to £11 billion. This is more than half the revenue that could be raised from full equalisation and is focused on those at the top who are currently paying the lowest tax rates.
Figure 3. Revenue that could be raised by an Alternative Minimum Tax on total remuneration at different tax rates

Notes: Constructed using data on all reported taxable income and capital gains going to individuals in 2016. Data were aggregated into quantiles of income/remuneration before constructing these figures. Minimum and maximum come from assuming all individuals within a given quantile have the lower/upper bound EATR for that quantile. Best estimate comes from interpolation within the quantile. Source: Authors’ calculations based on HMRC administrative datasets.
Conclusion
In the coming years, the pressure to rebuild public finances and to place crucial public services on a sustainable footing will inevitably require politicians to make tough choices about who should bear the burden of additional taxes. It is important that these debates are not framed exclusively through the prism of headline rates. What matters – both for revenue and the fairness of the tax system – is effective rates. Instead of asking ‘can the rich pay more?’, a better question may be ‘who amongst the rich is not paying enough?’
| Arun Advani and Andy Summers will be speaking today (15 June 2020) at 4 pm at the LSE online public event How much tax to the really pay and could they pay more? The event is free and open to all but pre-registration is required. |
|---|
♣♣♣
Notes:
- This blog post is based on the authors’ paper How much tax do the rich really pay? New evidence from tax microdata in the UK, CAGE Policy Briefing 27.
- The post expresses the views of its author(s), not the position of LSE Business Review or the London School of Economics.
- Featured image by chrisp120, under a Pixabay licence
- When you leave a comment, you’re agreeing to our Comment Policy
 Arun Advani (@arunadvaniecon) an assistant professor of economics and impact director of the CAGE Research Centre at the University of Warwick. He is also a research fellow at the Institute for Fiscal Studies, and a visiting fellow at the International Inequalities Institute. He studies issues of tax compliance and tax design, with a particular focus on those with high incomes or wealth.
 Andy Summers (@Summers_AD) is an assistant professor of law at LSE and an associate of the International Inequalities Institute at LSE. His teaching and research focuses on tax law and policy, particularly the taxation of wealth. His work also investigates the measurement of inequality using tax data.


A very clear and useful insight into future tax policy. I am a little less sanguine about the net amount of revenue it might raise, given the ability of the rich to pay clever people to find new ways of avoidance, but even so it could raise useful sums. I would also take an axe to most tax breaks further down the income distribution as well – they complicate and sometimes distort the system and are often ineffectual or the result of special pleading with a dubious justification in terms of the wider public good. The government would then have a choice of using the revenue saved to pay for more and better public services or cut tax rates or some combination of the two.
Exactly, it does’t require tax increasing on rich people but i would like to add one thing that the people who hides their money and didn’t show as rich persons need to be targeted.
I might be wrong but in that way, the current tax increasing situation could be controlled.