It is a commonly held belief that subprime lenders, who issue loans to risky borrowers, provide credit to high-risk communities that would not be able to get credit from low-risk lenders. Eglė Jakučionytė and Swapnil Singh challenge this view. They show that policy changes introduced in 1995 by US institutions Fannie Mae and Freddie Mac increased securitisation costs for lending in minority neighbourhoods. Prime lenders moved out and, with less competition, subprime lenders managed to enter these minority neighbourhoods with greater ease.
In the last two decades subprime lenders – lenders who issue loans to risky borrowers – have been in the spotlight for several reasons. These reasons range from financial stability concerns to predatory lending behaviour towards minority groups. Despite these concerns, as subprime lending made headway in the US, the view that has prevailed since the early 1990s is that subprime lenders provide credit to high-risk communities that would not be able to get credit from low-risk lenders (Collins et al., 2004). In our recent paper (Jakucionyte and Singh, 2021) we challenge this view by exploring the origins of subprime lending in minority neighbourhoods in the US in the 1990s. We show that the emergence of subprime lenders in minority neighbourhoods was due to advancements in lending technology and specific policies endorsed by the US Government Sponsored Enterprises (GSEs), Fannie Mae and Freddie Mac.
Figure 1 illustrates our point. The figure plots at the neighbourhood level the share of subprime lending against the Black population share for two periods: 1993-1995 and 1996-2000. During the period 1993-1995, there is no association between the share of subprime lending and the share of Black population in the neighbourhood. However, the relationship becomes positive during the 1996-2000 period.
Figure 1. Relationship between the share of subprime loans and the Black population share
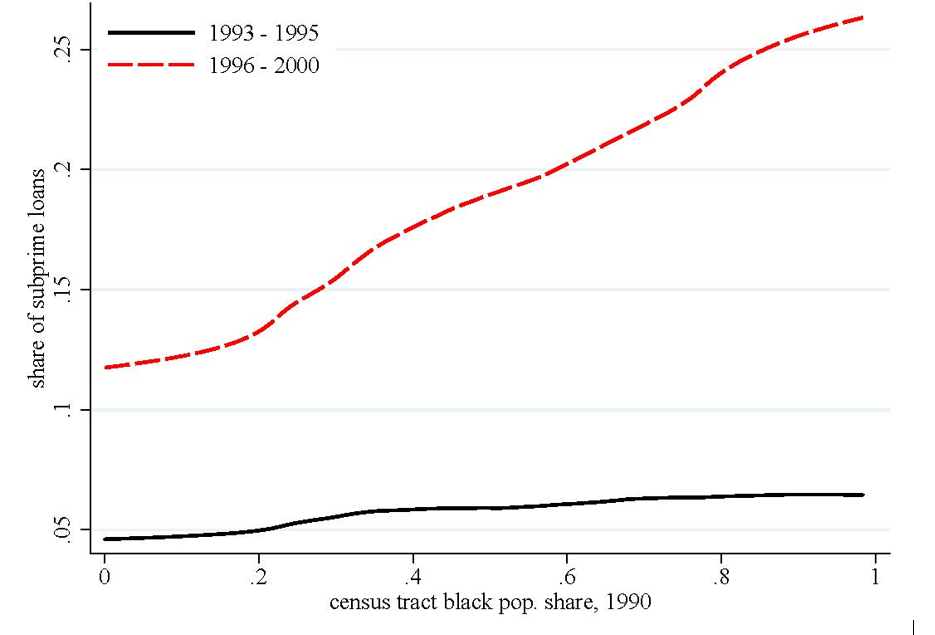
Source: Home Mortgage Disclosure Act data 1993–2000, Decennial Census 1990, HUD Subprime Lender List. Description: The figure provides the non-parametric relationship between the share of subprime loans and the census tract Black population share for two different periods: 1993–1995 (red solid line) and 1996–2000 (black dashed line). The census tract Black population share is winsorised at 1 and 99 percentile. Local polynomial regression with bandwidth equal to 0.1 is used for the non-parametric estimation.
The discrepancy between the two periods – 1993-1995 and 1996-2000 – is related to a specific change in 1995. Prior to 1995, US mortgage underwriting was conducted manually, which was slow, inaccurate, and perceived to suffer from underwriters’ personal biases. In 1995, Fannie Mae and Freddie Mac introduced two changes to address this problem. First, they made steps towards automating mortgage origination. Second, they sent letters to associated lenders, encouraging them to use FICO credit scores as an objective and precise measure of borrower’s creditworthiness. These institutions also provided specific cut-offs for credit scores and guidance to lenders regarding how to act when observed credit scores are above or below these cut-offs (Foote et al., 2019). For instance, if the credit score is below the specified cut-off, the application required a more extensive review by the underwriter before selling it to the GSEs. Implicitly, the GSEs signalled that credit scores would affect the chances of successful securitisation.
Importantly, the endorsement of credit scores by the GSEs and the provision of specific cut-offs affected only some credit suppliers – prime lenders. In the 1990s, subprime loans were mainly securitised in the private market (Temkin et al., 2002). This setup of the securitisation market is important to explain differences in lending after 1995. Since minority neighbourhoods have on average lower creditworthiness, the GSEs policy increased securitisation costs for lending in minority neighbourhoods. So prime lenders would have an incentive to shift to non-minority neighbourhoods—that is, neighbourhoods with a larger pool of low-risk borrowers. Subprime lenders were not directly affected by the policy, but they could enter minority neighbourhoods as a response to lower competition from prime lenders.
Figure 2 illustrates how the presence of subprime lenders changed across neighbourhoods after 1995. Controlling for differences across local mortgage markets throughout the US, we can see that the share of subprime lending in Black neighbourhoods increased disproportionately after 1995. In a specific regression framework, called difference-in-differences, we find that relative to the pre-1995 period, the difference between the share of subprime lending in minority neighbourhoods and non-minority neighbourhoods increased by 5 percentage points.
Figure 2. Share of subprime loans in low and high Black population census tracts
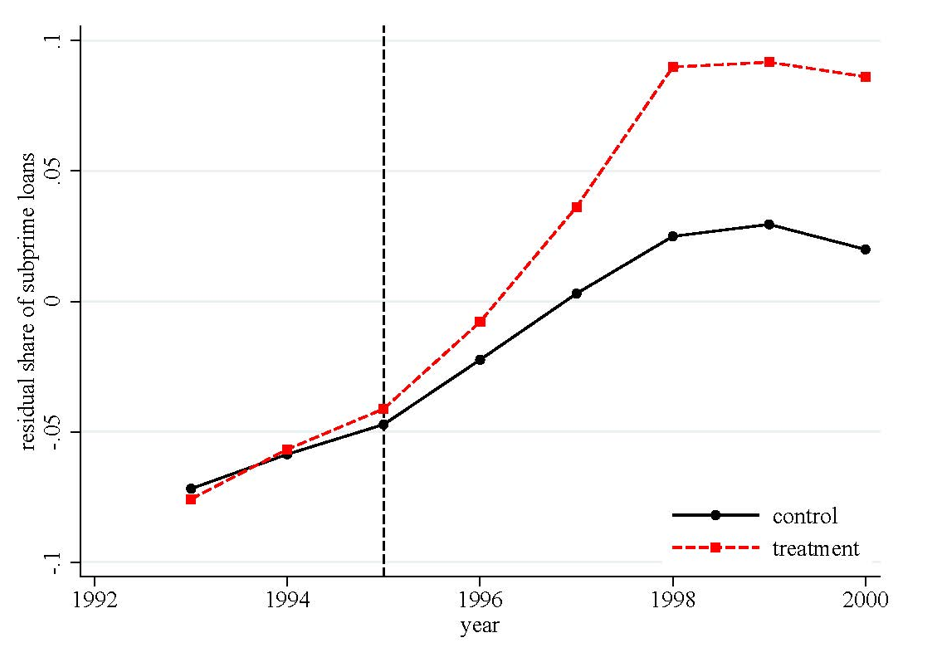
Source: Home Mortgage Disclosure Act data 1993–2000, Decennial Census 1990, HUD Subprime Lender List. Description: The figure plots the evolution in the share of subprime lending for treatment (red dashed line) and control (black solid line) groups. The treatment group refers to census tracts with Black population share in the top quartile. Residual share of subprime loans is constructed by partialling out county fixed effects.
The share of subprime loans increases after 1995 because prime lenders reduce lending in minority neighbourhoods relative to non-minority neighbourhoods. Figure 3 illustrates this point succinctly. Subprime lenders increased their lending in minority neighbourhoods relative to non-minority neighbourhoods, however, the reduction in prime lending in minority neighbourhoods preceded the increase in subprime lending and was stronger in magnitude, suggesting that prime lenders moved first.
Figure 3. Credit score endorsement effect on total lending
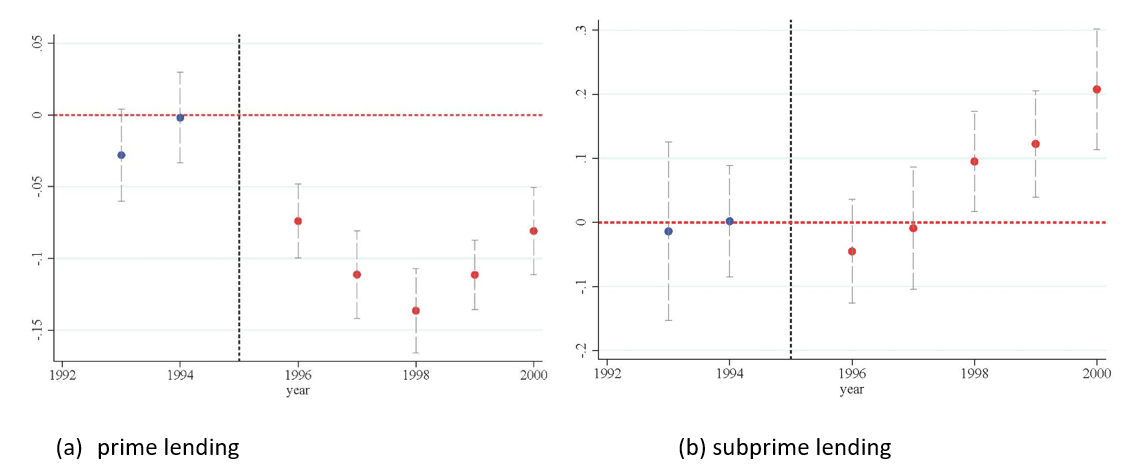
Source: Home Mortgage Disclosure Act data 1993–2000, Decennial Census 1990, HUD Subprime Lender List. Description: The figure shows the estimation results of the difference-in-differences model. Dependent variables are the logarithm of total amount of loan issued by prime lenders (left panel) and subprime lenders (right panel). All estimates are relative to the base year 1995, which is omitted. The regression includes year, census tract, and county-year fixed effects. The sample is constructed using only accepted applications and restricted to census tracts matched by propensity score matching. The regression is weighted by the total number of loans issued at the census tract-year level. In the final sample census tracts with less than five loans in a year are dropped. Black whisker lines report 95 percent confidence intervals. Standard errors are clustered at the state-year level.
Finally, to further associate our finding with the endorsement of credit scores, we look at the lending behaviour of prime lenders with a weak or strong relationship with Fannie Mae and Freddie Mac and illustrate this with Figure 4. As prime lenders who securitise more loans with the GSEs would be affected more by the new policy, they would shift from minority neighbourhoods to a larger extent than prime lenders who tend to securitise a small share of their mortgages. Figure 4 confirms this prediction. It shows that before 1995 prime lenders with a stronger relationship with the GSEs had a similar share of loans across the two groups of neighbourhoods, but after 1995 the share of loans by prime lenders with a stronger relationship with the GSEs decreased in minority neighbourhoods relative to non-minority neighbourhoods. Prime lenders with a weaker relationship virtually did not change their share of loans issued across neighbourhoods.
Figure 4. Credit score endorsement effect on the share of subprime lending, conditional on relationship with the GSEs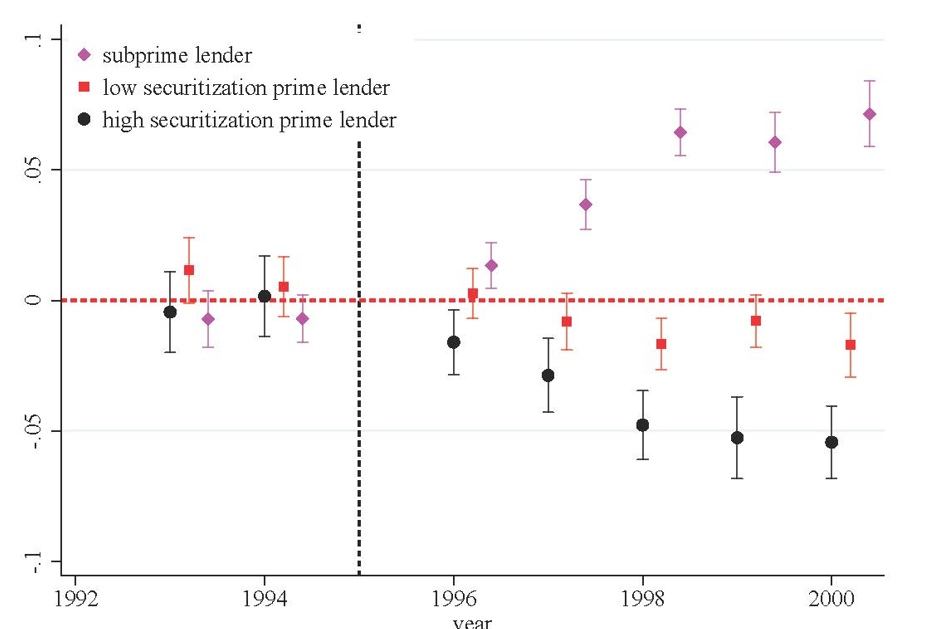
Source: Home Mortgage Disclosure Act data 1993–2000, Decennial Census 1990, HUD Subprime Lender List. Description: The figure shows the estimation results of the difference-in-differences model for three dependent variables: the share of subprime lending (magenta, diamond), and the share of low-securitization prime lender (red, square) and high-securitization prime lender (black, circle). Prime lenders are classified into low or high securitization groups based on the average share of conformable home purchase loans securitized over the period 1993–1995. All estimates are relative to the base year 1995, which is omitted. The regression includes year, census tract, and county-year fixed effects. The sample is constructed using only accepted applications and restricted to census tracts matched using propensity score matching. The regression is weighted by the total number of loans issued at the census tract-year level. In the final sample census tracts with less than five loans in a year are dropped. Black whisker lines report 95 percent confidence intervals. Standard errors are clustered at the state-year level.
Essentially, we show that the endorsement of credit scores along with specific guidelines had an unintended consequence. The endorsement of credit scores in mortgage underwriting contributed to the emergence of subprime lenders in minority neighbourhoods and the flight of prime lenders. These results suggest that borrowing conditions might have changed too. For instance, as minorities became more exposed to subprime lenders, they might have become more likely to obtain high-cost loans, even if they had similar credit scores to non-minority borrowers. Analysing the implications of lender sorting further would provide invaluable insights for the financial stability of minority borrowers and inequality across neighbourhoods.
♣♣♣
Notes:
- This blog post is based on “Emergence of Subprime Lending in Minority Neighborhoods”, Bank of Lithuania Working paper series, No. 94.
- The post represents the views of its author(s), not the position of LSE Business Review or the London School of Economics.
- Featured image by ArtisticOperations, under a Pixabay licence
- When you leave a comment, you’re agreeing to our Comment Policy.