

 The Greek bailout referendum resulted in a clear victory for the ‘No’ side, but what explained the choices made by voters? Ignacio Jurado, Nikitas Konstantinidis and Stefanie Walter present results from a detailed survey conducted in Greece the day before the referendum was held. Among the findings, they note that voting intention was heavily influenced by partisan narratives concerning the likely consequences of the referendum, with a majority of Yes supporters believing a Grexit would occur following a No vote, but only a small percentage of No supporters believing this to be true.
The recent ‘Greferendum’ on a draft bailout proposal submitted by the European Commission highlights the confounding effects of economic and political interdependence on democratic politics. Whereas the British electorate will be given up to two years in order to deliberate and decide over British membership in the EU (having already opted out of EMU), Greeks were asked to cast a vote of potentially existential repercussions over the country’s position in both the EU and EMU within the grand period of one week. The case of the Greek referendum is particularly interesting and topical in light of the high salience of the issue at hand, the stark policy constraints implicit in the vote, the excessively short time allowed for public deliberation, and the sharp discrepancies between different partisan narratives.
On the one hand, the Greek Prime Minister Alexis Tsipras proclaimed that a ‘No’ (Όχι) outcome would enhance the government’s negotiating clout, while on the other both the ‘Yes’ camp and European officials were publicly declaring the referendum to effectively be a vote on the country’s choice of currency. The European Summit agreement of 12 July, which followed the resounding ‘No’ victory and provided an admittedly harsh austerity-driven roadmap for the elimination of the possibility of Grexit, showed up both sides of the argument.
Much has been said already about the strategic intentions and the democratic constitutionality (in terms of content, framing, and timing) of this referendum. Instead, in this piece, we seek to report on the results of a survey designed by Stefanie Walter, Elias Dinas, Ignacio Jurado, and Nikitas Konstantinidis, and fielded by the University of Macedonia’s Survey Unit one day before the referendum vote of Sunday, 5 July. Despite the unclear nature of the referendum choices, the results of the survey neatly reflect general attitudes, preferences, and expectations towards economic and political integration from this small debt-ridden corner of Europe.
Preference vs. narrative-based explanations of Greferendum vote choice
At this point, we all know the result of the referendum: the ‘No’-side won with a whopping 61 per cent. But what explains the different vote choices? We think that there are two competing explanations.
On the one hand, people may have voted based on their preferences about their preferred course of action for Greece. In this regard, those more in favour of ending austerity – even at the risk of Grexit or leaving the EU – would have voted ‘No’, while those in favour of staying in the euro – even at the cost of more austerity – would have voted ‘Yes’. This is the kind of reasoning that moderate opposition and European politicians tried to evoke in the week leading up to the referendum vote.
On the other hand, Tsipras and his government framed the referendum differently and insisted that this was not about the euro, but about strengthening the government’s democratic mandate in the bailout negotiations. This narrative suggested that a ‘No’ vote would mean less austerity, while a ‘Yes’ vote would lead to more austerity, both within the Eurozone.
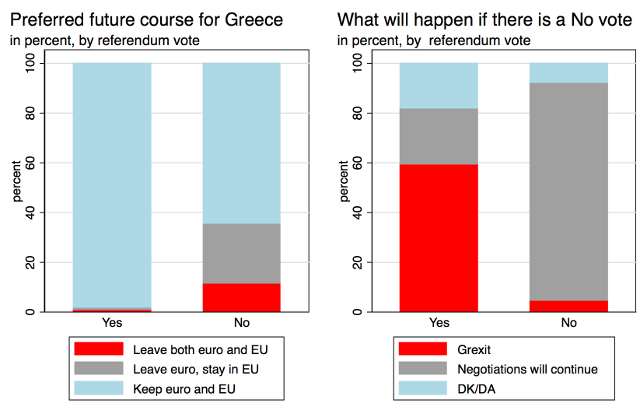
In our survey, we asked about both of these issues: respondents’ preferred course of action and the expected consequences of the referendum outcome. Figure 1 shows how these two questions are related with respondents’ vote intentions. It is evident that there are different preference profiles between those voting ‘No’ and those voting ‘Yes’. While a substantial part of ‘No’ voters wanted a different status vis-à-vis the EMU and the EU, virtually all ‘Yes’ voters wanted to stay in the euro and the EU.
What is more, differences in expectations about the implications of a ‘No’ outcome seem to be even larger. More than 90 per cent of ‘No’ voters expected their vote to lead to continued negotiations, while the majority of ‘Yes’ voters were convinced that a ‘No’ outcome would be a one-way ticket to Grexit. Therefore, it seems that the narratives about the implications of the referendum result were, in general, more powerful in explaining vote intention than preferences about the euro or the EU.
Figure 1: Preferences and expectations of Yes and No voters
Note: Data from original survey of 989 respondents conducted on 4 July 2015, © Stefanie Walter
The societal make-up of Yes and No voters
To get a more in-depth understanding of this result, we investigated the determinants of voting behavior in more detail. Figure 2 shows the share of ‘No’ votes by age, education, occupation, and vote in the January elections.
First, the vote was clearly divided along partisan lines. This underscores our finding that partisan narratives mattered to a large extent, with voters seeming to have toed party lines. Voters of the coalition government parties, SYRIZA and ANEL, but also supporters of the far-right Golden Dawn party, were clearly aligned to the ‘No’ vote. Voters of the moderate pro-European parties, New Democracy, PASOK, and To Potami, were clearly in favour of the ‘Yes’ vote. Meanwhile the Communist Party (KKE) adopted an interesting stance in favour of abstention, since they could never accept such harsh austerity measures, but also feared that a ‘No’ outcome would jeopardise their position on the far-left of the ideological spectrum and lead to the ideological hegemony of SYRIZA. It would seem then that the decisive group of ‘No’ voters consisted of those who voted for smaller parties and those who abstained in the January elections.
Second, some further interesting results arise in regard to the socio-demographic make-up of the vote. Surprisingly, occupation and education mattered little for vote intention. Although the unemployed came out overwhelmingly against the institutions’ proposal, there are otherwise small differences between different types of occupation. What we found particularly striking was that public sector employees had similar vote intentions to private sector employees, despite the fact that their salaries very much depend on overall public finances.
Another interesting paradox (not shown in the figure) that further underscores the notion that narratives mattered more than material self-interest is that the countryside was overwhelmingly in favour of ‘No’, while results were more evenly balanced in the urban centres. This is rather puzzling since the economy of non-urban and rural areas has been much less hit by the crisis, owing mostly to tourism and agriculture revenues as well as targeted transfers and subsidised prices. It should be noted, of course, that SYRIZA enjoys a strong organisational advantage in non-urban areas that arguably translated into higher campaign effectiveness. Some may argue of course that islanders were also voting against the proposed elimination of their VAT exemptions.
Figure 2: Referendum vote by socio-demographic factors
[fusion_tabs layout=”horizontal” backgroundcolor=”” inactivecolor=””]
[fusion_tab title=”Party support”]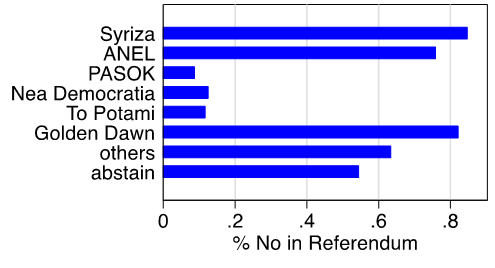
[/fusion_tab]
[fusion_tab title=”Age”]
[/fusion_tab]
[fusion_tab title=”Occupation”]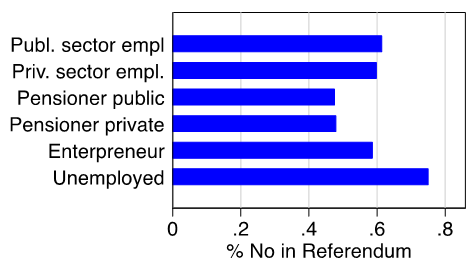
[/fusion_tab]
[fusion_tab title=”Education”]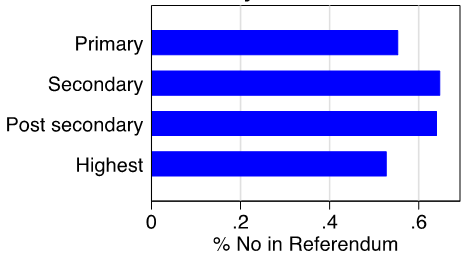
[/fusion_tab]
[/fusion_tabs]
Note: Data from original survey of 989 respondents conducted on 4 July 2015. For more information on the political parties see: New Democracy (Nea Democratia), Coalition of the Radical Left (SYRIZA), Panhellenic Socialist Movement (PASOK), Independent Greeks (ANEL), The River (To Potami), Golden Dawn.
Material interest-based explanations of Greferendum vote intention
Despite this slew of evidence in favour of the narrative-based explanation, we also found some evidence supporting the material interest-based (pocketbook voting) approach.
First, in terms of social demographics, the strongest divisive lines were between age groups. In other words, the referendum gave expression to a seething intergenerational divide. Young voters were massively in favour of the ‘No’ vote, while older voters seemed to fall more on the ‘Yes’ side. What then explains this stark difference in vote intentions between younger and older people?
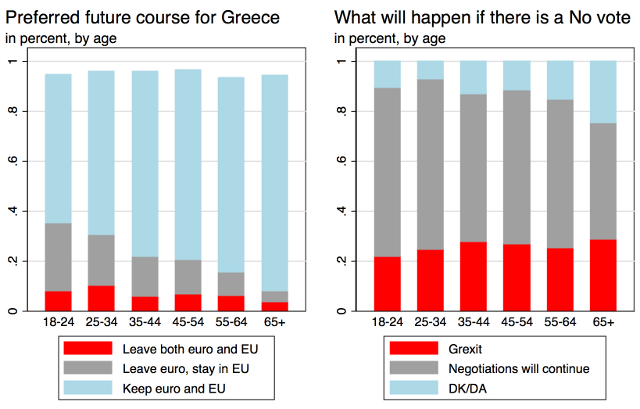
Figure 3 shows that the age divide is, if anything, a preference-based divide. Age groups are substantially less different in their expectations of what a ‘No’ vote would imply than in their preferences about the euro and the EU, with euro and EU membership remaining as the most popular choice across all age groups (these results should still be treated with caution, particularly given the survey was conducted via landline phone which may lead to the under-representation of low-income younger groups).
Figure 3: Age splits showed different preferences, but not different expectations of what a ‘No’ vote would mean
Note: Data from original survey of 989 respondents conducted on 4 July 2015, © Stefanie Walter
Another interesting piece of evidence that corroborates the importance of material interests is the average vote intention (shown in Figure 2) of the 55-64 age group, which mostly consists of employed people close to retirement. One may observe a sudden jump in favour of ‘No’ in that age group and a large gap between them and those 65 or older. A straightforward interpretation of this result is that the 55-64 age group is very much against pension reform as this would lead to the extension of the minimum retirement age and the elimination of the possibility for early retirement. Those already in retirement (65 or older), however, are more worried about the possibility of a bankrupt state that cannot pay their pensions rather than any pension cuts stipulated by a new bailout agreement. In line with this interpretation, the latter group was much less likely to vote ‘No’ than the former.
Second, we asked respondents whether the imposed bank holiday had affected their vote intention and about one fifth said that it had (as shown in Figure 4). Most of them actually switched their vote intention towards ‘Yes’. This would suggest that, as people increasingly internalised the costs of non-cooperation, they were becoming more willing to accept harsh austerity and conditionality measures in order to secure the country’s position in the euro.
About one third of those in favour of ‘Yes’ had considered voting ‘No’ before the banks were closed, whereas only 7 per cent of ‘No’ voters had considered voting ‘Yes’ before the shutdown. Moreover, the bank holiday had a particularly large effect on SYRIZA and Golden Dawn voters: about two thirds of those few favouring a ‘Yes’ vote against their preferred party’s recommendation had changed their vote intention as a result of bank closures. Overall, these results suggest that material concerns did in fact play into vote intentions over and above just partisan narratives.
Figure 4: Effect of bank restrictions on referendum voting intention
Note: Data from original survey of 989 respondents conducted on 4 July 2015, © Stefanie Walter
Finally, we ran a survey experiment on respondents’ preference vis-à-vis the euro, where we randomly varied information about the potential costs of remaining in the single currency. A first control group was asked whether it would be better for Greece to keep the euro or to introduce a national currency. Another group was told that, according to expert opinion, staying in the euro would require a few more months of pension cuts and tax increases, and a third group was informed that staying in the euro would require 4-5 more years of austerity.
Table 1 shows the results of this experiment for all voters and for ‘Yes’ and ‘No’ voters separately. Interestingly, support for EMU membership is very high: a clear majority of respondents were willing to endure more years of austerity in order to keep the euro. But the table also shows that this support is significantly lower among ‘No’ voters and this group also responds much more strongly to the cue that euro membership is associated with costs. Again, this should be interpreted as evidence in favour of the material interests-based approach.
Table 1: Share of respondents saying that keeping the euro is best for Greece’s future
Note: The control group was asked which of the possible options would be best for Greece’s future, while the two treatment groups were asked which option was best for Greece’s future under the scenario stated above.
Greferendum: a distorted expression of true democratic will?
In presenting the results of our survey, we have not purported to rationalise people’s votes solely on the basis of pure cost-benefit calculations, but instead sought to draw a more complicated picture of beliefs, expectations, preferences, and emotive reactions to the harsh dilemmas of globalisation and political integration. The obtuse nature of this referendum very much reflects the distorted realities of globalisation in terms of political representation, democratic accountability, and freedom to choose one clear-cut policy programme or another.
People nowadays are often presented with stark, often bogus, dilemmas, compounded by a clutter of highly technical and often misleading information on issues they never had to consider before. Notwithstanding instrumental cost-benefit explanations of voting behaviour, our findings may be viewed through the lens of a deepening democratic deficit. The gradual erosion of national sovereignty and the deep-rooted frustration with states’ inability to single-handedly tackle a range of festering problems (unemployment, fiscal imbalances, environmental degradation, immigration, etc.) has left many people feeling effectively disenfranchised from the democratic process. The trite assertion that there are no dead-ends in democracy has started to ring hollow in today’s globalised world.
Please read our comments policy before commenting.
Note: This article gives the views of the authors, and not the position of EUROPP – European Politics and Policy, nor of the London School of Economics. Featured image credit: Die Linke (CC-BY-SA-3.0)
Shortened URL for this post: http://bit.ly/1fh3ABn
_________________________________
 Ignacio Jurado – University of York
Ignacio Jurado is Lecturer in Politics at the University of York.
–
 Nikitas Konstantinidis – University of Cambridge
Nikitas Konstantinidis is University Lecturer in International Political Economy at the University of Cambridge. He is also a member of the Greek Public Policy Forum.
–
 Stefanie Walter – University of Zurich
Stefanie Walter is Professor in International Relations and Political Economy at the University of Zurich.




You don’t mention the predicted outcome for the referendum itself. This information would help infer on how representative the group of respondents is. Please give some information on the identity of the sample and the survey method.
In our sample we have 36.7% YES (or leaning toward yes), 52.8% NO (or leaning toward no) and 10.5% undecided.
The poll was carried out by telephone by the University of Macedonia Research Institute and surveyed 989 respondents identified through multi-stage stratified sampling.
Well done Stefanie, the research is fascinating and the first time I’ve seen any real evidence on what people thought beyond Yes/No (referendums always reduce things down to binary options that aren’t particularly representative of how people feel).
Where can I find the full results of your survey? Thank you.
I have an observation to make. // You don’t take into account that a day before the vote the specific questions could not be perceived by the respondents in a neutral way, especially the No-voters. For No-voters to admit publicly that their vote leads to Grexit (either as a fact, or as his own will) would be to accept the hostile pro-yes rhetoric of the media. In such a moment it seems to me quite natural for them not to answer objectively. I.e. to refuse any connection of No-vote with the Grexit and to adopt the rhetoric of Tsipras (that the No-vote will help the negotiation) or a variant (that it will help to a better solution). // Therefore I’m afraid that your conclusions are not so much reliable.