Polling companies were heavily criticised for failing to predict the results of the UK’s EU referendum and Donald Trump’s presidential election victory, but is this criticism fair? Abel Bojar draws on evidence from recent European elections to illustrate that opinion polls have a far better record of success than they’re given credit for.
Some professions are dealt a bad hand when it comes to public acknowledgement of their competence. Firemen are seldom acclaimed for every fire they extinguish and the engineers that designed the smoke detection system are unlikely to be credited for preventing a fire from breaking out in the first place. By contrast, when things go wrong, as they do every once in a while, the very same professionals have to endure heightened scrutiny at best and a litany of accusations and criminal proceedings at worst. They failed to do their job properly and endangered lives as a result, after all. Never mind the thousands of other lives they did save.
In the world of social sciences, public opinion pollsters are well aware of this asymmetry in the public mind. For all the tremendous effort and resources that go into improving sampling and weighting techniques, they are unlikely to be acclaimed for getting an election right. When they get one wrong, however, the public fallout is typically loud and clear, as recently evidenced by the Brexit referendum and the US presidential election. Never mind that some of these critiques are oblivious to basic concepts, such as sampling error, or less basic ones that are often beyond pollsters’ control, such as social desirability bias.
The backlash is partly understandable. The consequences of bad polling are not quite as dire as bad firefighting, but they can have a lasting impact on the political community. If a party is underpolled relative to its true level of support in the population, some of its voters may strategically desert it in favour of a stronger rival, making the bad poll ratings self-fulfilling and (ex-post) accurate after all. Conversely, if a party’s support is overestimated and the party is predicted to sweep the elections with a landslide, some of its supporters may either get complacent (“they don’t need my vote to win”) or strategically vote for another party fearing an excessive concentration of power. In both cases, bad polling distorts the representative function of elections, damaging the overall quality of democracy.
It is thus of crucial importance to empirically assess the quality of polling by putting some of those “bad” polls in a comparative context. I shall not aim to provide a broad overview of polls in the vast universe of elections and referenda. My goal is much more modest: I select a few recent parliamentary elections occurring in the turbulent post-crisis period in Europe – 15 elections from 8 countries, to be precise – and compare the last 12 months of polling averages to the final election outcome. Each monthly observation is the average of all polls taken in the month (an average of 14.4 polls per month across the 15 election windows). Many of these countries were hit hard by the Great Recession and the ensuing Eurozone crisis of 2009-2013 and experienced great upheavals in their party system as a result. They thus serve as a hard test for assessing polling quality as polling is inherently more difficult in turbulent times.
Polling has the awkward feature that it is unverifiable in a strict sense, save for the much less controversial exit polling on election day. At any given point in time a poll is taken, no elections are occurring and therefore the actual level of support for a party remains unknown. However, the more proximate the polls are to the elections the more likely they converge with the actual election results, provided the polling is accurate. In addition to the 12-month comparison, I thus zoom in on the polling averages of the months of the election and approximate the polling error by the difference between this monthly average and the election result.
Figure 1 below provides a summary plot for each of the 15 elections. Relatively flat lines indicate that the party’s support was stable over the 12 months before the election and its level was captured well by the pollsters. Gradually trending lines (or line segments) converging with the election outcome suggest that the parties experienced important gains and/or losses before the election and the monthly poll averages captured these changes fairly accurately. The problematic pattern for polling accuracy is when the last data point, referring to the actual election result indicated by the large circles at the end of the series, displays a sudden leap or drop compared to the previous observation.
While it is theoretically possible that something dramatic happened at the 11th hour that swayed a large number of voters, a more likely conclusion is that polling had been inaccurate. Instances of these patterns are the Italian elections of 2013 when the Five Star Movement’s actual support was grossly underestimated or the 2015 January elections in Spain when both newcomers’ (Ciudadanos and Podemos) levels of support were overestimated.
Most elections, however, are better described by the first two scenarios. For instance, the level of support for the main German political parties was rather flat in the run-up to the 2009 elections and the final outcome validated these estimates. Also, the collapse of the two main political parties (PASOK and New Democracy) as well as the rise of the far-left (Syriza) and far-right (Golden Dawn) challengers in the fallout of the Greek debt saga in 2012 can be clearly traced by the polls over the preceding 12 months.
Figure 1: Pre-electoral evolution of the main political parties’ estimated popularity (click to enlarge)

Source: Compiled by the author.
To get a numeric sense of the polling errors, Figure 2 provides a snapshot of the difference between the average of the last polls taken in the month of the election and the election outcome itself (ranging from the largest underestimates to the largest overestimates) on a party-specific basis. On both ends of the spectrum, as previously mentioned, some grave errors undoubtedly took place, such as the underestimation of the Five Star Movement (M5S) in Italy (2013), Civic Platform (PO) in Poland (2011) and the overestimation of PSOE (2011) and Podemos (2015) in Spain.
That said, most of the average estimates are distributed within the range of -2% to 2% compared to the election outcomes. To be precise, the average polling error (in absolute value) is 1.52%, a figure that is greatly influenced by some of these outliers: 81% of the poll averages are within 2%, 62% of the poll averages are within 1.5% and 46% of the poll averages are within 1% of the election outcome. Since we are talking about averages as opposed to a single poll, the conventional confidence intervals – typically 2-3% – don’t apply. It is therefore the reader’s judgement call to decide if this level of precision is satisfactory or not.
Figure 2: The distribution of 68 political parties’ polling errors across 15 elections
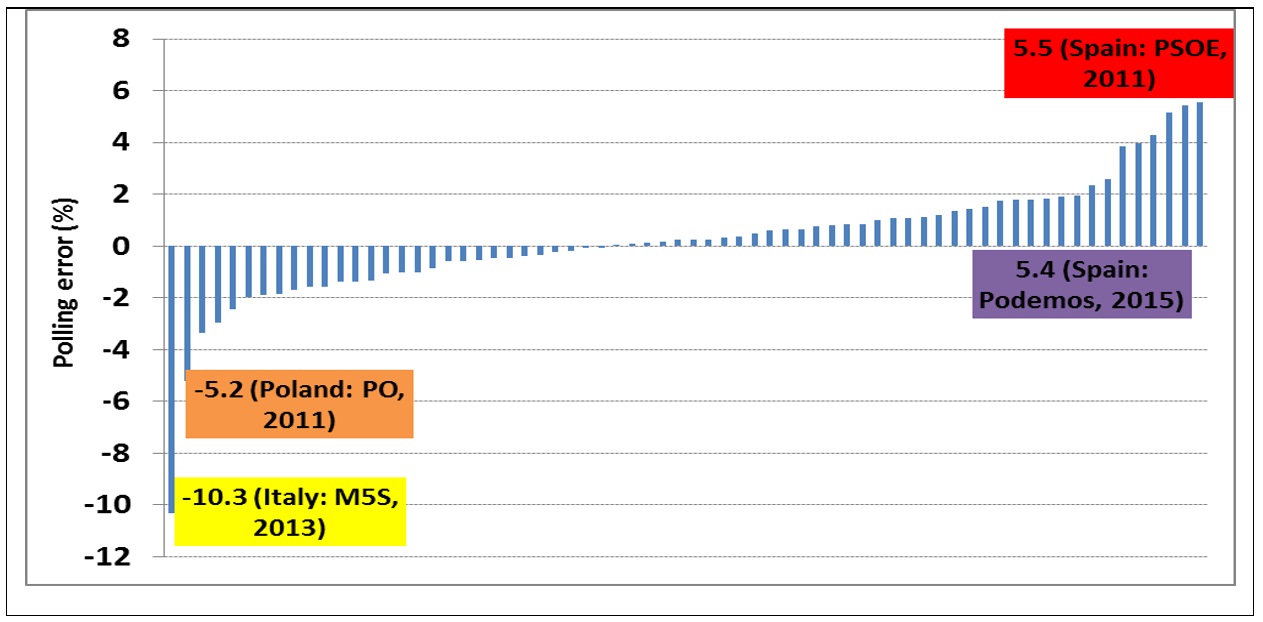
Source: Compiled by the author.
What can be stated with a degree of certainty – with the caveat of the small sample size of elections that I surveyed – is that the wide misses that most commentators are quick to pick up on are more the exceptions than the rule. Amidst some of the election outcomes that pollsters failed to accurately predict, we should not forget the much larger pool of elections that they did. Given the inherent difficulties in obtaining a random sample in a society composed of millions of individuals with all sorts of reporting biases and the limited scope for weighting them by their politically salient characteristics, this is itself no small feat. Pollsters surely deserve a round of applause for that.
Please read our comments policy before commenting.
Note: This article gives the views of the author, and not the position of EUROPP – European Politics and Policy, nor of the London School of Economics.
_________________________________
 Abel Bojar – LSE European Institute / European University Institute
Abel Bojar is LSE Fellow in Political Economy of Europe at the LSE’s European Institute and a Research Fellow at the European University Institute, Florence.