 Evidence of the UK’s economic performance since the EU Referendum is clear: GDP growth has slowed down, productivity has suffered, the pound has depreciated and purchasing power has gone down, and investments have declined. In this blog, Josh De Lyon and Swati Dhingra argue that the impact of the Brexit vote on the health of the economy can now be evaluated with greater accuracy than previously.
The impact of the Brexit vote can now begin to be evaluated with greater accuracy than previous forecasts, thanks to the emergence of new data. In the run-up to the UK’s referendum on membership of the European Union (EU) in June 2016, a number of research reports estimated the likely economic impact of Brexit (see, for example, Dhingra et al. 2017, HM Treasury 2016 and Kierzenkowski et al. 2016). Most studies predicted that Brexit would have a negative impact on UK GDP over the long term. Before and after the vote, a few studies have also attempted forecasts of economic outcomes in the short term, with varying degrees of accuracy. Typically, these studies have either been based on theoretical modelling or, if they drew on data, they have only used information from before the vote (De Lyon et al. 2017). Now, however, some post-referendum data are available, which can be used to evaluate the health of the economy since the Brexit referendum.

Firstly, the UK’s GDP growth has slowed down. In broad macroeconomic terms, GDP growth in the UK has been low but remained positive since the referendum. Relative to G7 countries, however, the UK has slipped from having the highest growth rate in the G7 before the vote, to the lowest now (OBR 2018). This suggests GDP growth has held up likely as a result of international trends, but it is showing weakening internal trends.
Productivity has also suffered. The negative signs of economic health are confirmed by the outcomes in productivity stagnation. Output per worker has continued to be stagnant since the referendum. Worryingly, the gap between output per worker in OECD countries and the UK has widened since the referendum, as shown in Graph 1.
Figure 1: Output per worker in the UK and OECD

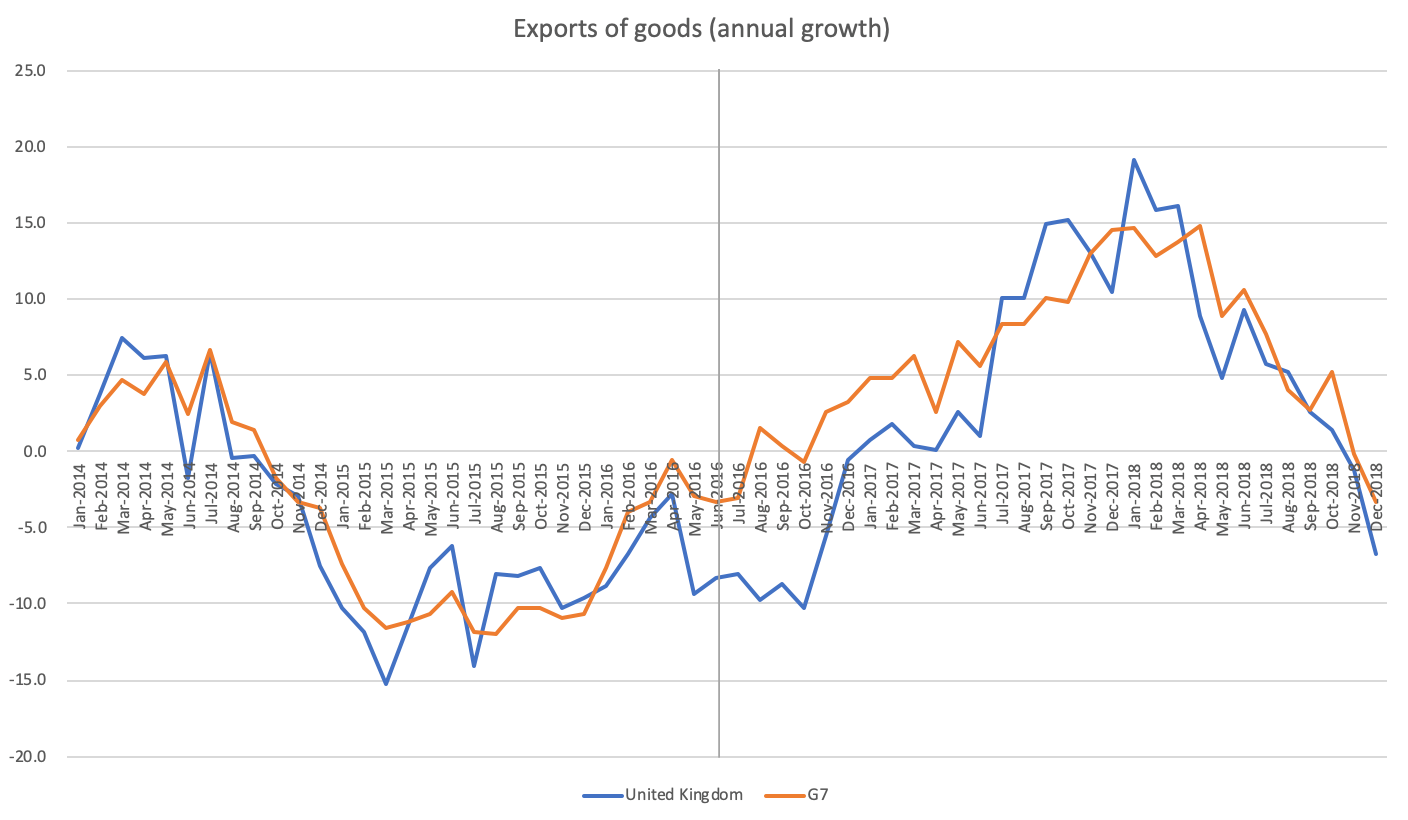
The sterling has depreciated and increased costs. The single biggest economic shock immediately after the referendum has been an unprecedented drop in the value of the pound. On referendum night, the pound fell from a high of $1.50 to $1.33. This is the single biggest drop in the daily exchange rate since the 1970s among the four major currencies of the world. The sterling depreciation was expected by some to spark an export boom, but this has not happened. Relative to G7 countries, the value of exports from the UK have not grown faster, as shown in Graph 2. Industry data confirm this. For example, car exports decreased to both EU and non-EU countries in the three months to December 2018. There is also some evidence to suggest that exports might have been curtailed as a result of the trade policy uncertainty arising from the Brexit vote (Crowley et al. 2018, Graziano et al. 2018).
Figure 2: Exports (UK and G7)

Source: OECD data
The value of imports into the UK has been broadly slower than in the G7 countries, as shown in Graph 3. But the rise in the price of imports, as a result of the sterling depreciation, has raised the costs of intermediate inputs, which are needed by businesses. Sectors more exposed to the overnight sterling depreciation, through their existing global supply chain structure, have seen higher increases in import costs. These industries show lower wage growth and reduced training opportunities since the vote to leave the EU (Costa, Dhingra, Machin 2019 ). The fallout of higher import costs has to a degree fallen on UK workers in terms of lower earnings now and in the future through fewer skill development opportunities.
Figure 3: Imports (UK and G7)

Source: OECD data
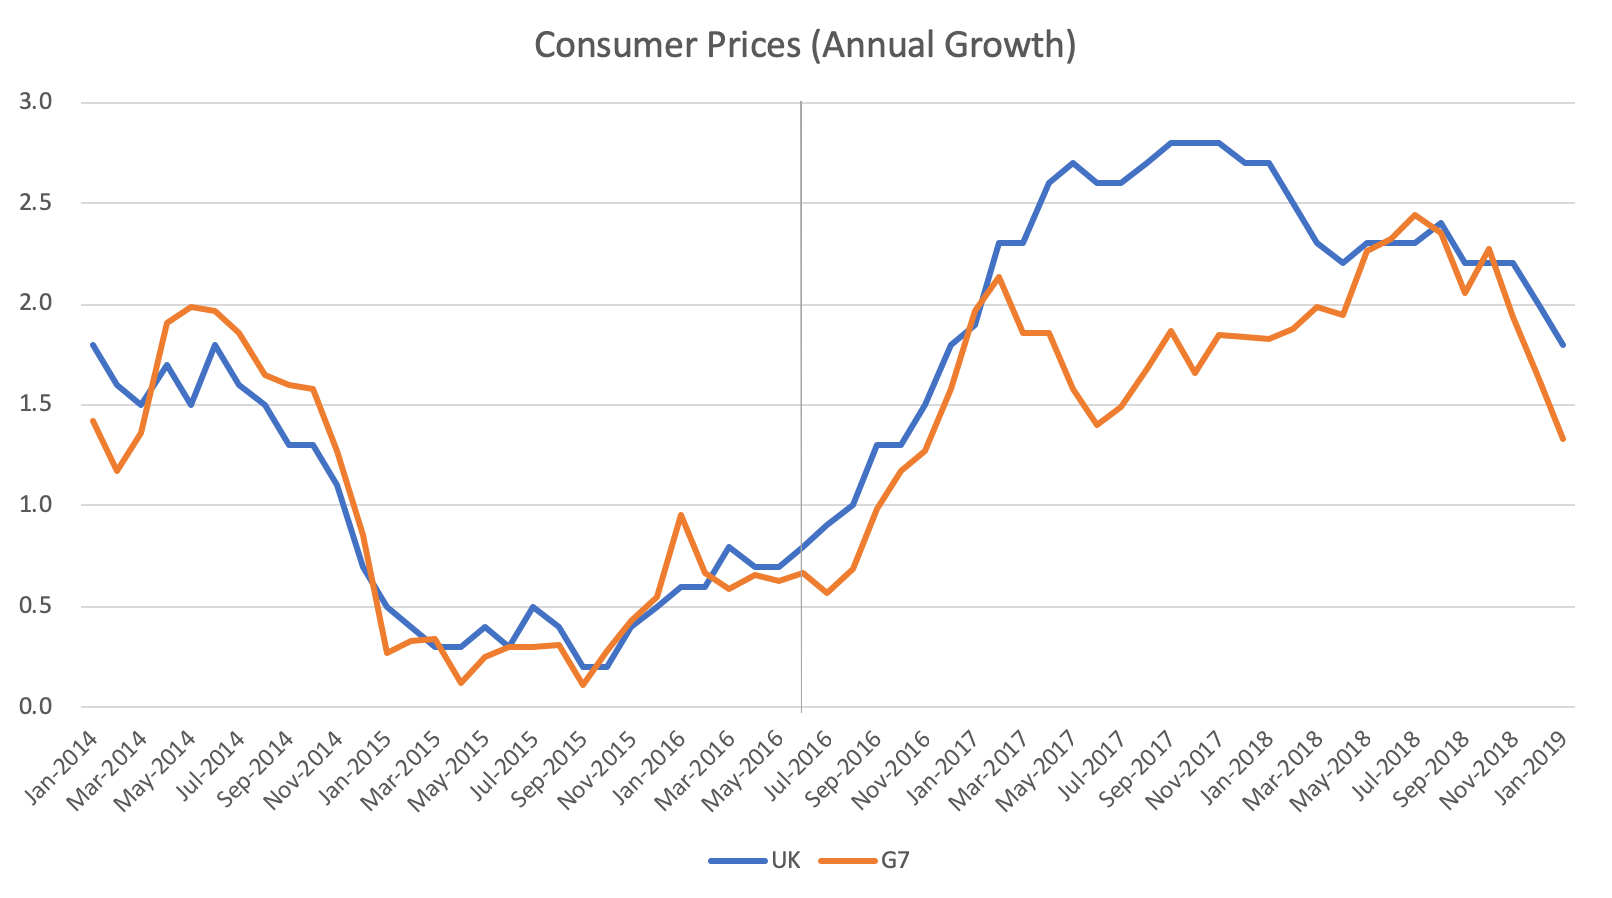
Purchasing power has gone down. On average, real wages have been flat since the referendum. Nominal wages have risen, but below the previous 2% norm (ONS 2018). Consumer prices have risen to reduce real wages. Inflation rose sharply after the referendum and remained high till recently. In January 2019, it dropped below 2% for the first time since the referendum but is still at 1.8%. Growth in food prices, which was as high as 4.4% following the referendum, has returned to low levels of inflation (De Lyon et al. 2017). Compared to G7 countries, consumer price inflation continues to be higher but has fallen closer, as shown in Graph 3. Estimates suggest that aggregate inflation increased by 1.7 percentage points or £7.74 per week as a result of the referendum (Breinlich et al. 2017).
Figure 4: Consumer prices (annual growth)

Finally, both inward and outward foreign direct investment (FDI) have dropped since the referendum. The most recent FDIdata available are for 2017. The value of the UK’s inward FDI position increased by £149.2 billion to £1,336.5 billion in 2017 from 2016, while the outward position increased by £38.7 billion to £1,313.3 billion over the same period; this led to a slight negative net FDI investment position of £23.2 billion, the first time that this has been recorded (ONS 2017). Compared to selected control groups of similar developed countries, estimates suggest that the Brexit referendum result on inward FDI is a drop of 11 to 19 per cent compared to the counterfactual in which the referendum did not happen (Serwicka and Tamberi 2018, Breinlich, Leromain, Novy, Sampson 2019). On outward investments, estimates suggest a 12% increase (or £8.3 billion till 2018Q3) in the number of new investments made by UK firms in European Union (EU) countries.
Overall, the real economy shows signs of productivity and real wage stagnation, which has taken the UK much lower than other high-income countries since the Brexit referendum. Financial outcomes have shown mixed results, with the sterling down but the FTSE 250 continuing to perform relatively well since the referendum (London Stock Exchange 2019).
Please read our comments policy before commenting.
Note: This article first appeared at our sister site, LSE Brexit. It gives the views of the author, not the position of EUROPP – European Politics and Policy or the London School of Economics. Image by Ken Teegardin from Boulder, Boulder, (CC BY-SA 2.0)
_________________________________
Josh De Lyon – LSE
Josh De Lyon is a Research Assistant in the Trade Programme at the Centre for Economic Performance (CEP), London School of Economics.
Swati Dhingra – LSE
Swati Dhingra is an Associate Professor of Economics at the Department of Economics, LSE, Research Associate at CEP and Research Leader at The UK in a Changing Europe.


GDP per person employed is a curious way to measure economic output, particularly when the number of people employed has increased markedly
Total GDP % growth rate seems an odd metric not to show in a graph here. Maybe because it does not support the negative message so well?
“This suggests GDP growth has held up likely as a result of international trends, but it is showing weakening internal trends.”
This surely shows how bad the pre-referendum forecasts of gloom and doom were? Recession, mass unemployment ….. all just noise within an overriding international trend that buoyed us up? Serious omission to show the graph and compare it wit forecasts.
“Most studies predicted that Brexit would have a negative impact on UK GDP over the long term. Before and after the vote, a few studies have also attempted forecasts of economic outcomes in the short term, with varying degrees of accuracy.” Treasury incuded – and a dire effort it was.
“Typically, these studies have either been based on theoretical modelling or, if they drew on data, they have only used information from before the vote (De Lyon et al. 2017). Now, however, some post-referendum data are available, which can be used to evaluate the health of the economy since the Brexit referendum.”
Care to comment on what the new, ore credible data/forecasts tell us compared with the previous ones?
No reference to COVID, no reference to growth in 2021/22, only discusses pre COVID therefore is 2 years out of date. Doesn’t mention total GDP % rate growth because it wouldn’t support the narrative. This is a like a poor A level essay using only arguments that support their position.