Economists and sociologists have often adopted different approaches to measuring inequality. Drawing on a new study, Nicolas Duvoux, Adrien Papuchon and Senmiao Yang attempt to bridge this gap by analysing wealth and income distributions among occupational groups in five European countries.
As European societies attempt to recover from the Covid-19 pandemic and endure the economic shock from Russia’s invasion of Ukraine, socioeconomic inequalities have never been more relevant. Yet there is little consensus on how best to measure economic inequality in the realm of economics and sociology.
Two factors that have traditionally formed the focus of analyses of inequality are people’s incomes and their occupations. John Goldthorpe’s class schema, where employment relations play an essential role in social categorisation, has become prevalent in sociological reasoning and comparative analysis in different social, political, and cultural settings.
However, since its publication in 2014, discussions on how best to measure economic inequality have been heavily influenced by Thomas Piketty’s Capital in the 21st Century. Piketty argues that wealth, including property, valuables, and other financial assets, is another form of capital that is far more unequally distributed than income. From this starting point, he aims to measure the share not only of income but also of wealth held by the top 10% and 1% of the world’s population.
These measures allow him to move the study of inequality beyond abstract measures such as the Gini coefficient. He also introduces the wealth-to-income ratio as an efficient measurement of economic inequality in different countries over the long term. Wealth-inequality dynamics enable him to put forward a multidimensional concept of class, where various dimensions, such as education and occupation, play a role in the evolution of wealth inequality.
Echoing Piketty’s reflections, work by Mike Savage and his co-authors has used UK national survey data to provide important methodological improvements for wealth inequality analysis. This work criticises the almost exclusive interest of sociologists in occupations and further broadens our understanding of how economic inequality should be measured.
Inequality and occupational groups
In a new study, we seek to build on these theoretical and methodological legacies to bridge the gap between the conceptions of economists and sociologists about class inequalities in Europe. To do so, we use cross-national survey data collected by the European Central Bank in 2014 as part of its Household Finance and Consumption Survey (HFCS).
One of the key questions we address relates to occupational groups and class. Piketty identifies the rise of a ‘patrimonial’ middle-class as the main transformation that occurred in the structure of European societies during the twentieth century. This refers to those in the 50th to 90th percentiles of the wealth distribution. Yet, it is still unclear which occupational groups belong to this class and which do not.
Although the ECB’s Household Finance and Consumption Survey contains data from 20 European countries, we focus on five countries that are representative of distinct social welfare regimes: Finland, France, Germany, Ireland, and Spain.
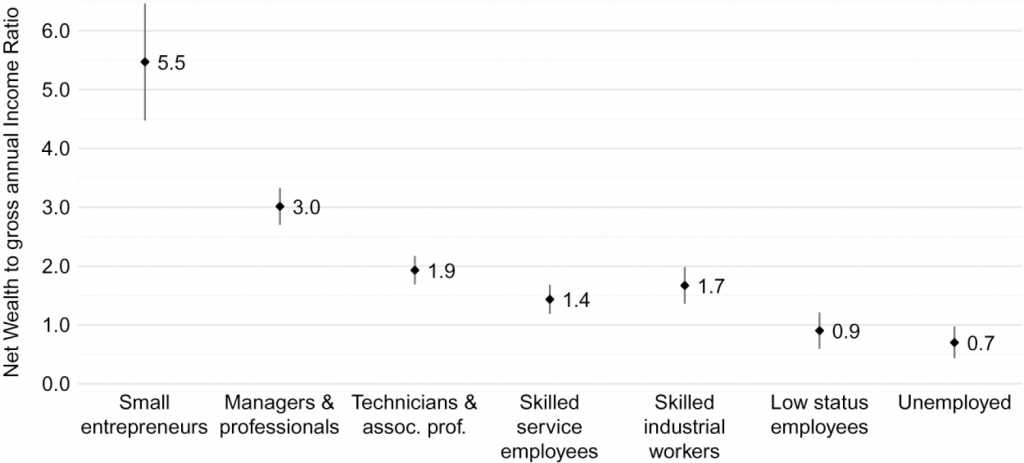
Figure 1 below illustrates how the wealth-to-income ratio differs in these countries across seven occupational groups (the European socioeconomic groups – ESeG). The results are striking, with clear divisions existing between small entrepreneurs, managers and professionals, skilled white and blue-collar workers, and low-status workers and the unemployed.
Figure 1: Median total net wealth-to-income ratio by European socioeconomic group
Note: The figure shows household net wealth expressed in number of years of household current gross income. The vertical lines specify the 95% confidence intervals. The figure is based on people in the labour force aged 18 years or older living in Finland, Germany, Ireland, Metropolitan France, and Spain. Source: Household Finance and Consumption Survey, wave II.
Small entrepreneurs possess net wealth equivalent to 5.5 years of accumulated income, while the figure drops to less than a year for the unemployed. The gap between small entrepreneurs and top wage earners is also large, with the latter holding net wealth equivalent to only three years of accumulated income. White-collar workers hold a relatively large amount of net wealth, while low-status workers and the unemployed clearly struggle to accumulate wealth that can act as a buffer against economic uncertainty.
Resilience to economic shocks
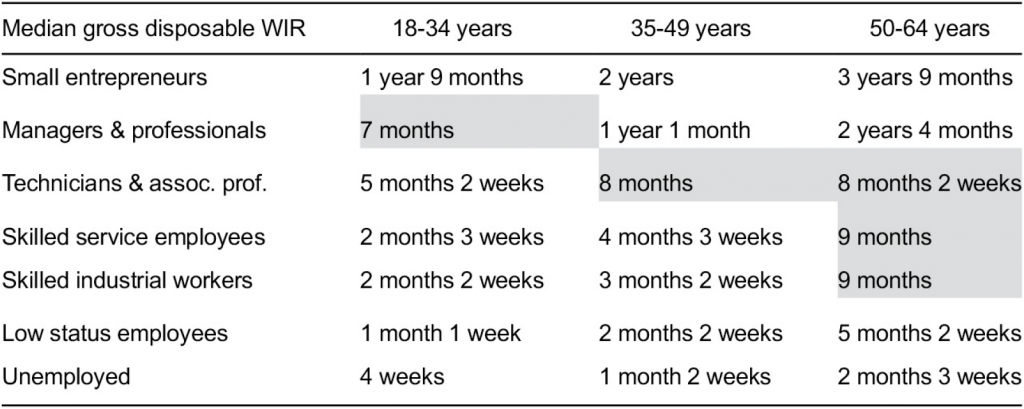
From both an occupational and an age perspective, which groups hold a sufficient safety net of accumulated wealth to protect them during economic shocks? We tried to evaluate the life-cycle’s effect on wealth accumulation to simulate such circumstances. Our results are shown in Table 1 below.
Table 1: Median gross disposable wealth-to-income ratio during economic shocks
Note: The figure shows how accumulated wealth would change for each group during a simulated economic shock. Groups with a median gross disposable wealth-to-income ratio of six months or less are located below the grey cells; groups with a median gross disposable wealth-to-income ratio higher than one year are located above the grey cells. The figure is based on people in the labour force aged 18 years or older living in Finland, Germany, Ireland, Metropolitan France, and Spain. Source: Household Finance and Consumption Survey, wave II.
It turns out that only small entrepreneurs, as well as elder managers and professionals, are capable of sustaining economic security during an economic shock without relying on public safety nets, formal or informal employment security, and/or familial transfers.
Similar to Figure 1, there is a clear divide between the groups shown in the table. Our findings indicate that across the five different countries we studied, class inequalities represented in wealth accumulation gaps might increase one’s exposure to economic precarity, especially for younger generations and those with a vulnerable or unstable employment status.
Differences between countries
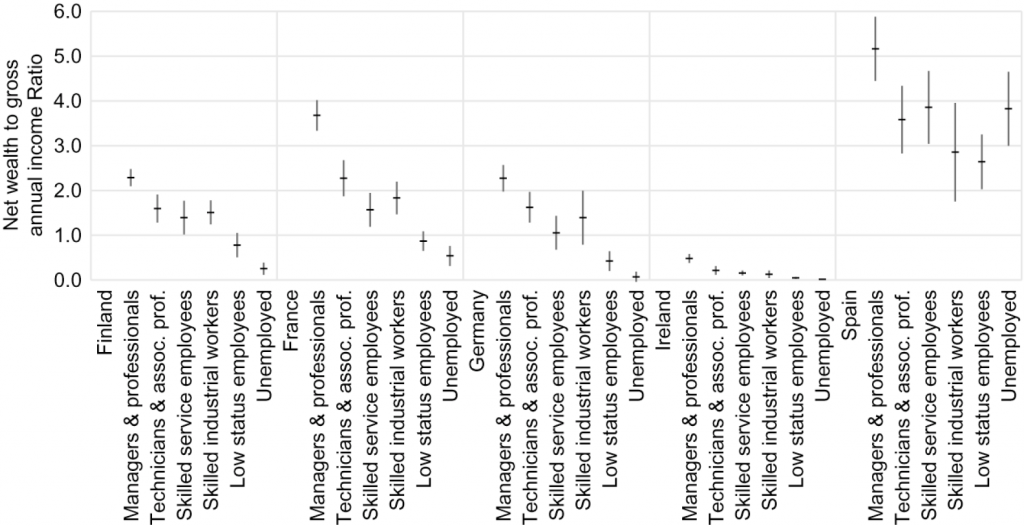
Most countries in the sample followed the structure identified above but there were three distinct patterns when the countries were compared with each other. As shown in Figure 2 below, Finland, France, and Germany were consistent with the structure identified above; Ireland showed a relatively lower median wealth-to-income ratio than the rest; and Spain had a median wealth-to-income ratio that was far higher than the other countries, as well as lower intergroup inequality.
Figure 2: Total net wealth-to-income ratio by European socioeconomic group and country
Note: Household net wealth expressed in number of years of household current gross income. The vertical lines specify the 95% confidence intervals. The figure is based on people in the labour force aged 18 years or older living in Finland, Germany, Ireland, Metropolitan France, and Spain. Source: Household Finance and Consumption Survey, wave II.
Levels of disposable wealth and home ownership help explain these differences. In Ireland, there is a high rate of home ownership, defined as ownership of a ‘household’s main residence’ (or HMR), yet the country also has a low net wealth-to-income ratio. This does not result from Ireland having relatively high household incomes in comparison to the other four countries, but rather from high debt levels.
On the contrary, Spain, which has a much lower household income but a higher net wealth-to-income ratio, has extensive home ownership across all social classes. Spain also has high levels of private debt. The debt-to-income ratio is substantially higher for blue-collar workers, low-status workers and the unemployed than it is for top wage earners. This could put these groups in a vulnerable position if a future economic crisis rocks the real estate market.
An uncertain future
The future that emerges from Thomas Piketty’s work is one of a class-structured, neo-Victorian society that is dominated by the unearned wealth of a hereditary elite and a patrimonial middle class. Our findings appear consistent with this as we identify three distinct class clusters, each following highly unequal wealth accumulation paths.
Our analysis suggests European societies are currently divided between those who have substantial wealth, those who aspire to have wealth (the middle and working classes), and those who lack wealth entirely. Wealth is not only a criterion of privilege but also acts as a buffer against insecurity. The destabilisation of labour markets caused by the rise of the gig economy is a further source of precarity, particularly among younger generations.
For all these reasons, wealth inequality clearly matters for European societies. The great mystery is not whether the persistent widening of interclass wealth gaps will have an impact on our future, but why there is such a lack of interest among policymakers in establishing a strategic, systemic, and structural response to it.
For more information, see the authors’ accompanying paper in the European Journal of Sociology
Note: This article gives the views of the authors, not the position of EUROPP – European Politics and Policy or the London School of Economics. Featured image credit: Anthony Tyrrell on Unsplash


