 In Mexico City, COVID-19 has spread in line with existing patterns of spatial segregation and inequalities. While the poorest neighbourhoods have been the hardest hit, many of the wealthiest have seen very few cases, writes Máximo Ernesto Jaramillo Molina (INDESIG and Atlantic Fellows for Social and Economic Equity).
• Disponible también en español
In January, Reuters reported that Mexico had surpassed India in confirmed deaths from COVID-19, giving it the world’s third-highest death toll. In Mexico City, the continent’s second-largest urban centre, the COVID-19 pandemic has led to over 521,000 infections, 124,000 hospitalisations, and 32,000 deaths, according to data from SEDESA (the Ministry of Health of Mexico City) up to 14 February.
What has been less well reported is which parts of the city, and which groups of people, have been the worst affected. To date, most of the spatial analysis of the pandemic’s impact in Mexico City has been at a municipal level of disaggregation, mainly because of the difficulty of working with neighbourhood-level data. But the heterogeneity of the city’s municipalities, and the high degree of socio-economic segregation between and within them, means that we are at risk of drawing erroneous conclusions from municipal-level analysis.
For example, a recent analysis of a sharp upturn in cases in Mexico City in December focused on the higher prevalence of cases in “affluent areas”, and pointed to Coyoacán, a historic zone that is one of the city’s main tourist areas, as the municipality leading the increase in cases. Although in aggregate Coyoacán is not among the city’s poorest municipalities, it nevertheless includes multiple neighbourhoods with a high level of deprivation and marginalisation. Moreover, characterising Coyoacán as an “affluent area” overlooks the fact that most of its COVID-19 cases have been concentrated in its poorest neighbourhoods.
But when we carry out more detailed analysis that combines the neighbourhood-level database of the Social Development Index published by the Council for the Evaluation of Social Development of Mexico City (Evalua-CDMX) and the historical data on active cases from ADIP (Mexico’s Digital Agency for Public Innovation), we can see clearly that the pandemic has hit Mexico City’s lower-income neighbourhoods hardest, while its wealthier neighbourhoods have been the least affected.
The difference between the two analytical approaches is striking. Municipal-level analysis indicates that Iztapalapa, Gustavo A. Madero, and Álvaro Obregón are the municipalities with the most cases of confirmed infections during 2020, and Milpa Alta, Magdalena Contreras, and Iztacalco as those with the highest per-capita rate of infections.
The face of deprivation: mapping Mexico City’s infection hot spots
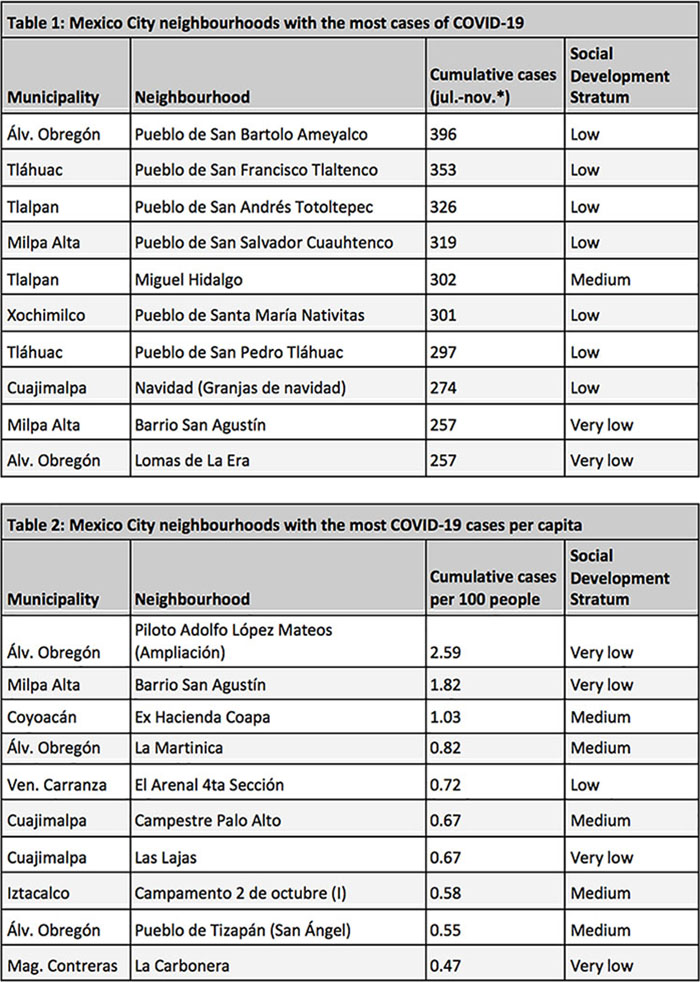
The more disaggregated analysis shows us a totally different face of the pandemic in the city. When we look at historical active cases at the neighbourhood level, some of the zones with high levels of socio-economic deprivation – San Bartolo Ameyalco (Álvaro Obregón municipality), San Francisco Tlaltenco, and San Pedro (both in Tláhuac), San Salvador Cuauhtenco (Milpa Alta), and Santa María Nativitas (Xochimilco), all in the south of the city – were those with the highest number of cases between July and November of 2020.
The analysis is even more revealing when we look at the per-capita rate of confirmed coronavirus cases by neighbourhood. Those with the highest rates are Piloto Adolfo López Mateos (Álvaro Obregón), Barrio de San Agustín (Milpa Alta), Ex Hacienda Coapa (in Tlalpan), La Martinica (Álvaro Obregón), and El Arenal IV Sección (Venustiano Carranza), most of which have high rates of poverty and low levels of social development. Some of these results can be seen in the table below.
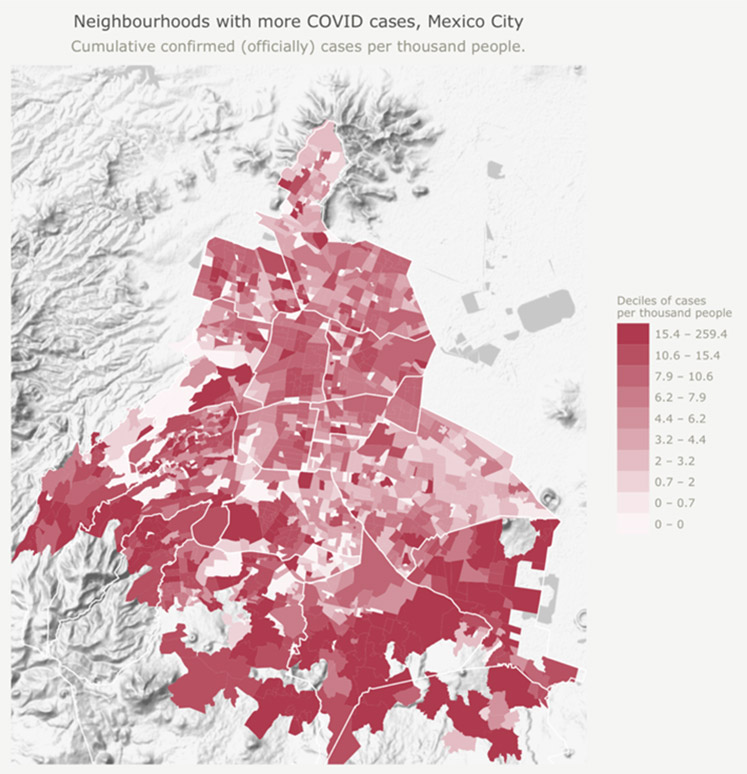
It is notable that most of the Mexico City neighbourhoods with a high number of infections are in the city’s poorer, peripheral zones, and there is a marked absence of “affluent areas” in this group. The following map offers a visualisation of this trend, allowing us to observe the rate of accumulated cases across neighbourhoods. The darker red-coloured neighbourhoods are those with the highest rates of infection, and the lighter-coloured areas indicate those with lower rates.
Around the world, we have seen a close relationship between the social stratum to which households belong and the likelihood that their members will become infected. This is likely due to the need to go out and earn an income to survive, often in the face of government-imposed quarantines. This is especially true in countries such as Mexico, and cities such as Mexico City, where almost half of the population lives in poverty, according to the National Council for the Evaluation of Social Development Policy (CONEVAL). The pandemic has made a bad situation even worse: some 63% of households saw their income drop during the worst months of the economic crisis in 2020.. Moreover, most of the city’s poorest households (57%) receive no social protection payments at all.
When staying home is a privilege, and earning a living can be deadly
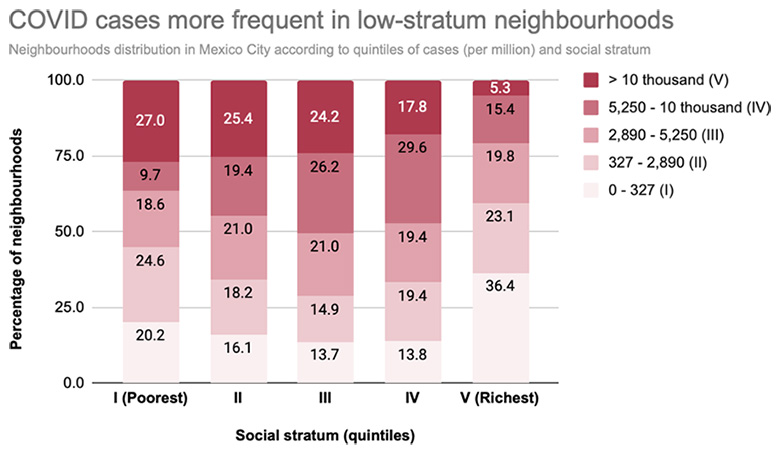
In Mexico City during the pandemic, as in so many places worldwide, staying home has been a privilege. So has escaping infection, as a proposal by Mexican civil society organisations recently noted. This harsh reality is confirmed by our analysis, which combines data on infections at the neighbourhood level and data on the social stratum of those infected. Across the city, the combination of underlying deprivation and novel coronavirus has been devastating: infection rates in the poorest 20% of neighbourhoods in Mexico City have been five times higher than those in the wealthiest 20%.
To look at it another way, 27% of the poorest neighbourhoods are among those that have recorded the most cases, while only 5% of the richest are in the high infection rate category. More tellingly still, one in in three of the wealthiest neighbourhoods did not have a single case of COVID-19 between July and November of last year, while this happened in only one in five of the poorest.
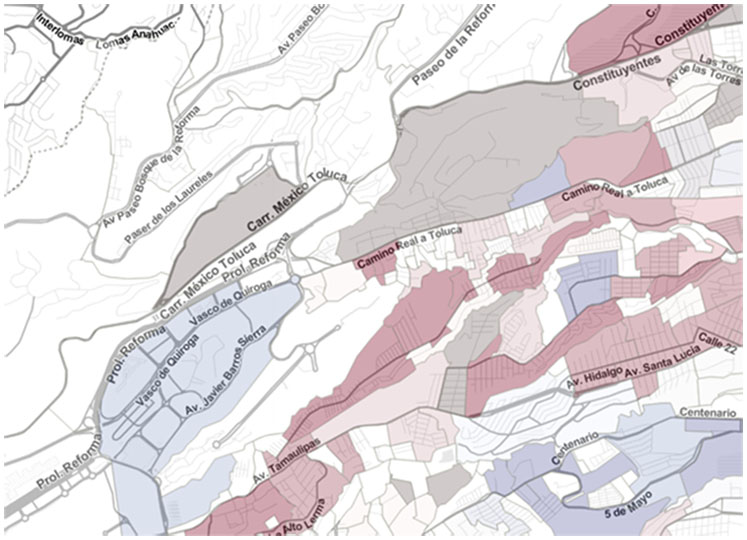
These results make it clear that although the virus has spread throughout Mexico City, there is an important spatial/geographical pattern associated with underlying inequalities. The map below clearly shows the relationship between the highest rates of COVID-19 cases and the social stratum by neighbourhood. The darkest red areas show the low socio-economic stratum neighbourhoods that recorded the highest rates of infection (greater than 10,000 per million inhabitants, equivalent to 1% of the population), while the darkest blue areas are high socio-economic neighbourhoods with similarly high rates of infection. The dark red areas are clearly much more abundant than the dark blue ones.

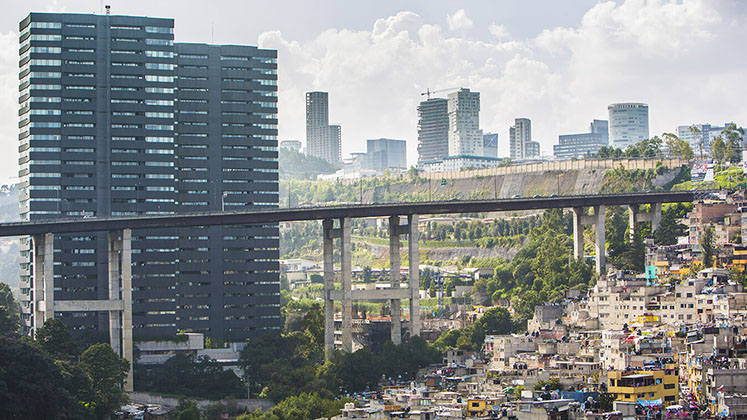
Even in neighbourhoods that are geographically close but socio-economically very unequal, the patterns of urban segregation are clearly reflected in patterns of COVID-19 infection. A good example is Santa Fe, whose stark inequalities are memorably highlighted in aerial photographs by another Atlantic Fellow for Social and Economic Equity, Johnny Miller, for his Unequal Scenes project. Santa Fe contains some of the wealthiest neighbourhoods in the city, including Lomas de Chapultepec, Lomas de Reforma, Corredor Santa Fe and Portal del Sol, and in these areas the rate of COVID-19 infections is almost zero (as we can see in the map below, which uses the same colour scheme as the previous one). In contrast, in the towns of Santa Fé and Santa Lucía, as well as other marginalised neighbourhoods, the infection rate is one of the highest in the city.
How do we combat the rise in inequality caused by the pandemic?
In December 2020 and January 2021, Mexico City saw a resurgence of the pandemic, to the extent that the state returned to “red” in the epidemiological risk scale which is used to determine local policy responses. Some non-essential economic activities were halted, hospital capacities reached or exceeded their limits for several consecutive weeks, and there was a sharp rise in deaths and excess mortality. Although the analysis presented here draws on data only until 12 December 2020, it nevertheless demonstrates the importance of understanding the links between poverty, the obligation of poorer people to leave home for work, and the rise in infections (and deaths) that such activity generates.
As has already been shown, the higher the number of COVID-19 infections there are in the city, the greater the infections (and deaths) among Mexico City’s poorest inhabitants. This fact should be of the greatest concern to us: this is a pandemic whose deadly effects hit marginalised people the hardest.
In order to reduce infections and avoid more deaths, both the national and Mexico City governments must strengthen their test-and-trace strategy and widen the distribution of social protection payments, but they must also target these initiatives better by using a spatial approach and taking social stratum (and the realities of the poorest households) into account. Although the CDMX (capital region) government has been one of the few state-level governments in the country to pursue a neighbourhood-focused response (increasing testing in the most affected neighbourhoods, for example), the terrible truth is that Mexico City’s administration has not managed to adapt to the deadly truth whose warning signs were evident even at the very beginning of the pandemic: the virus does not affect everyone equally. It infects (and kills) the poorest because of the extreme inequalities that were a fact of life long before the arrival of COVID-19.
Notes:
• The views expressed here are of the authors rather than the Centre or the LSE
• A version of this article was originally published in Spanish on Animal Político, and the English version first appeared on the Atlantic Fellows for Social and Economic Equity blog
• All graphs, maps, and charts: © 2021, Máximo Ernesto Jaramillo Molina
• Please read our Comments Policy before commenting


Thank you for the excellent analysis Mr. Jaramillo. Do you have any information on the ethnic makeup of these neighborhoods? I am looking for more information on indigenous outcomes during the pandemic.
Thank you,
Amanda