When Mrs Thatcher was Prime Minister, from 1979 to 1990, the most popular measure of income inequality for Great Britain, the ‘Gini coefficient’, rose from 26.1 to 36.6 after allowing for changing housing costs – by more than 10 percentage points. This took Britain from being a more equal country than many others to one of the most unequal industrialised countries in only just over a decade.
But that happened nearly thirty years ago. Why is inequality so much more of an issue in many ways today? In joint work, Polina Obolenskaya and I looked in detail at economic outcomes and inequality trends between different population groups over the two decades from 1995-96. Our results have just been published in the Oxford Review of Economic Policy and can also be found as a CASE research paper, part of a programme funded by the Nuffield Foundation.
Trends in overall income inequality using the same Gini measure have been far less dramatic than in the 1980s – rising from 37.3 in 1995-96 to 38.8 in the latest available year, 2017-18, for instance, a seventh as much in twice the time.
So why is inequality so much more of a big deal, not just in the UK, but across many parts of the world, including LSE setting up our own International Inequalities Institute?
There are several reasons. First, inequality – gaps between people’s resources – can be measured in many different ways. While the Gini coefficient gives a good idea about inequality across the whole of the income range, people may care most about particular kinds of inequality. For instance, the income share of the top 1 per cent – and top 0.1 per cent – in the UK continued to rise until the crisis hit in 2008.
And while in some ways inequality in Britain has been relatively flat for the last two decades, the increases of the 1980s have not been reversed, and we have now been living as a high inequality society since the early 1990s.
One knock-on effect of the way this has allowed the best off to save more is that, increasingly, it may not be just the gaps in people’s flow of income over a year that matter, but also their stock of wealth, which has become more unequal, as well as much bigger in value, especially as a result of rising house prices.
But in our paper we also look at what has been going on below the relatively calm surface of inequalities over the two decades. This highlights three particular features. One is that there was such a contrast between the two decades in overall growth in wages and living standards. In retrospect it is easy to forget how much they rose in the first decade, from 1995 to 2005, and therefore how great the contrast was with the second decade of near-stagnation. It is one thing politically for there to be high (or even rising) inequality, if accompanied by growth at most levels. It is quite another for inequality to be maintained on an historically high plateau while accompanied by stagnation.
Second, the relative fortunes of younger adults declined sharply in all the respects we examine, particularly after 2005. Median hourly pay fell in real terms for men and women in age groups up to 30-34 between 2005 and 2015. However, pay continued to grow for men aged over 54 and women aged over 34. Over the whole twenty years, pay grew by more than a third for men and women aged 55 and over, but by less than 20 per cent for those in their twenties. Even for the best-paid men and women at each age there was a strong age-gradation in growth.
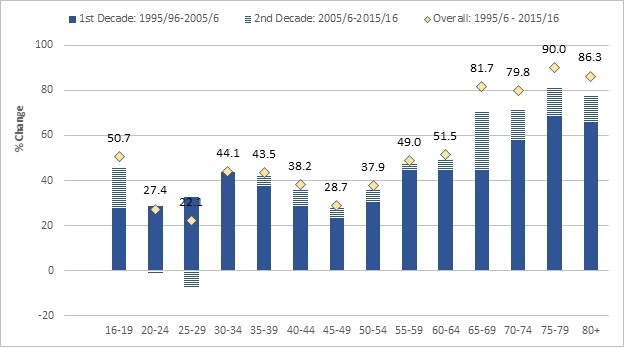
This carried over into more complete measures of living standards – total household income, with those over State Pension Age gaining most, as the figure below shows. After allowing for housing costs, median incomes of those aged 65 or over rose by more than 80 per cent over the whole period, including continued growth after 2005. But for those in their twenties, growth in median incomes was less than 30 per cent, all coming in the first decade.
Change in median incomes after housing costs by age group, 1995-96 to 2015-16 (2015-16 prices)
Looking at other breakdowns (with a wide range available here), those between population groups defined in other ways show more complex patterns, often with contrasts between the worst-off within each type and those with median or higher resources. A number of groups did particularly badly in different respects during the slow-growth decade from 2005 to 2015:
- The incomes of the poorest lone-parents;
- The incomes after housing costs of the poorest Londoners;
- Median household wealth in the East Midlands and North East;
- The incomes of the poorest social tenants;
- Median incomes and wealth of Black African households; and
- Disabled individuals and households in general, especially the wages of disabled women and the incomes of the poorest disabled adults.
The apparent ‘stability’ in income inequality, at least, over the period is therefore something of a mirage: the nature and depth of economic inequalities have changed markedly for some groups even if overall levels remained relatively stable.
Note: This article gives the views of the authors, and not the position of the Social Policy Blog, nor of the London School of Economics.