Healthcare in India is a critical sector, now being the most populous country in the world. Government initiatives and investment play a central role in providing both affordability and access. Vrinda Gupta examines the latest figures of the National Health Accounts, and analyses the possible causes that lie behind them.
The latest National Health Accounts (NHA) estimates (2019–20) indicate a significant drop in Out-of-Pocket Expenditure (OOPE) on healthcare in India, from 64.2 per cent of Total Health Expenditure (THE) to 47.1 per cent between 2013–14 and 2019–20. This decline is in contrast to the meagre drop of 5.2 per cent in the previous decade (from 69.4 per cent in 2004–5 to 64.2 per cent in 2013–14). This post explores factors that may have contributed to this steep fall in OOPE.
One possible explanation may be an increase in government healthcare expenditure (GHE). However, a closer examination shows that the increase in GHE between 2013–14 and 2019–20 was a mere 0.22 per cent (similar to the increase between 2004–5 and 2013–14). Further, state-level data indicates that there is not much correlation between OOPE and GHE: for example, while GHE in Kerala is 1.1 per cent of its Gross State Domestic Product (GSDP), OOPE accounts for two-thirds of it’s the; I in contrast, GHE in Karnataka is just 0.8 per cent of its GSDP, but OOPE accounts for only 31 per cent of its THE. Overall, the correlation between GHE as a percentage of GSDP and OOPE as a percentage of THE is a mere 0.01 per cent (Figure 1).
Figure 1: Relationship between OOPE and Government Health Expenditure
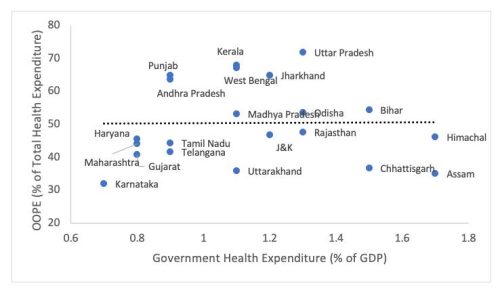
Source: National Health Accounts, Ministry of Health and Family Welfare, Government of India, 2019–20
Aanalysis of cross-country trends in the relationship between GHE and OOPE shows a quadratic relationship between OOPE and GHE (Figure 2). To witness a decline of 15 per cent in OOPE, India would ideally have needed to increase its GHE by approximately 1.5 per cent — which was not the case. Therefore, it is clear that an increase in GHE alone cannot explain the significant fall in OOPE seen in recent times.
Figure 2: Relationship between OOPE and Government Health Expenditure: Cross-country Analysis (2019–20)
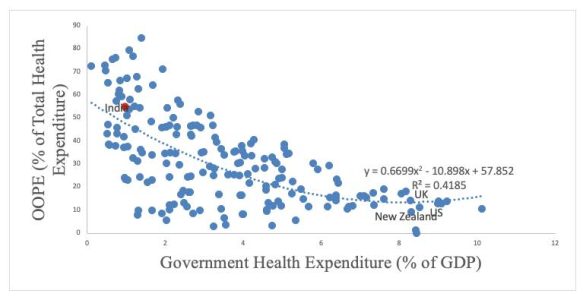
Source: World Health Organisation Global Health Expenditure Database
Although GHE did not increase significantly, an up-tick in the utilisation of public health facilities and a simultaneous decrease in the cost of outpatient and inpatient services at these facilities may explain the decline in OOPE (Muraleedharan et al. 2020). However, while the share of public health facilities in total hospitalisation cases increased, in fact overall hospitalisation rates fell. This may be due to demand for healthcare/hospitalisation services, which in a growing economy like India may reflect distress in the economy (Mukhopadhyaya et al. 2021). It is also noteworthy that the richer sections of society have increased their utilisation of public health facilities much more than the poorer sections (Muraleedharan et al. 2020). As a result, the decline of OOPE was more prominent among the richer than the poorer (Mohanty et al. 2022). This could have long-term implications for inequities in India (Banerjee and Chowdhury 2020).
Digging deeper into the role of distress economy in reducing OOPE, it seems that OOPE in real terms fell from ₹ 2,040 in 2013–14 (approx. US$ 24.53 to ₹ 1,646 in 2019–20 (approx. US$ 19.80, the main drop coming between 2016–17 and 2017–18 when OOPE fell from ₹ 2,056 (approx. US$ 24.73) per capita to ₹ 1,626 (approx. US$ 19.56) per capita. Real per capita THE fell by 5 per cent during the same time period.
It is unusual to expect OOPE per capita to fall in a growing economy like India, with a rising middle class. In fact, this drop contrasts with global developments where OOPE per capita rose for all country groups. Although some individual economies (like Turkey) experienced a significant decline in per capita OOPE, it was largely due to a major government intervention (Venkateswaran and Singh 2022). However, in the case of India, in the absence of a major supply-side or demand-side health intervention, such a steep fall might reflect reduced consumption of health services rather than a sustainable fall in OOPE.
The reduced consumption of healthcare has to be viewed in the context of overall decline in consumption growth after 2016–17 (Wadhwa, 2019) when consumption growth fell from an average 6 per cent between 2004–5 and 2016–17 to 4 per cent between 2017–18 and 2019–20 (National Accounts Statistics MOSPI 2020). It is possible that distressed economic conditions may have led households to forgo some health expenditure during this period.
Another potential factor is the contribution of private healthcare: this includes employer-based insurance, non-profit institutions serving households, enterprises’ financing schemes, and other primary coverage schemes. The role of private players in THE has risen from 7.2 per cent in 2013–14 to 11.5 per cent in 2019–20. Within this, private health insurance expenditures as a percentage of THE rose significantly — from 3.4 per cent in 2013–14 to 7 per cent in 2019–20. At the state level, the correlation between the contribution of private players (as a percentage of GSDP) and OOPE is negative 0.35 (Figure 3). Data from Central Bureau of Health Intelligence (2021) shows that adoption of private insurance among richer quintiles was much higher than among poorer quintiles and, as noted earlier, upper classes saw a sharper decline in OOPE over the period. This highlights the role of private insurance in reducing household OOPE.
Figure 3: Relationship between OOPE and Private Financing Schemes
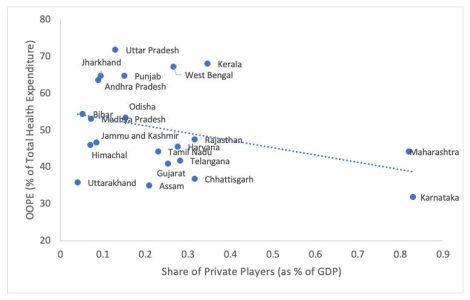
Source: National Health Accounts, Ministry of Health and Family Welfare, India, 2019-20
Note: The results might seem to be driven by two states- Maharashtra and Karnataka. However, they together account for 15% of India’s population and cannot be termed as outliers. Using an alternate indicator- Percentage population covered by private insurance-provide similar correlation
Social security expenditure by the government can be clubbed under 2 headings: government employees’-related health insurance (Central Government Health Scheme (CGHS), Ex-Servicemen Contributory Health Scheme (ECHS) and Employee State Insurance Scheme (ESIS)) and government-financed voluntary health insurance schemes (Pradhan Mantri Jan Arogya Yojana (PM-JAY), etc). This expenditure by the government increased from 3.7 per cent to 5.7 per cent of THE between 2013–14 and 2019–20. However, insurance schemes catering to government employees (CGHS, ECHS, ESIS) account for two-thirds of the government’s total health insurance expenditure. Since the benefits of these schemes are limited only to government employees, the general public remains bereft of insurance. Increasing the participation of the general public under voluntary health insurance schemes will be critical in reducing inequality as well as sustaining the fall in OOPE without a commensurate decline in demand for healthcare services.
The decline in OOPE is undoubtedly a positive trend for Indian healthcare, but the reasons behind it are complex and multifaceted. While an increase in utilisation of public health facilities can explain part of the decline in OOPE, overall reduction in hospitalisation rates and fall in consumption growth point towards reduced healthcare demand (forgone care), which may reflect underlying distress in the economy. Further, a greater decrease in OOPE among the richer classes as compared to poorer classes has long-term implications for health inequities. Both these aspects of the recent fall in OOPE warrant further investigation. The contribution of private players towards healthcare, particularly in the form of health insurance, has been on the rise and may be a significant factor in reducing household OOPE. However, private insurance is not easily accessible by the poorer sections of the society, and may lead to rise in inequalities in future.
To address these issues, Universal Health Coverage (UHC) must be supported by a strong public health sector. Increasing public expenditure on health to 2.5–3 per cent of Gross Domestic Product (as envisaged in the National Health Policy 2017) can decrease the OOPE to 30 per cent of THE (GOI, 2021). In order to reduce OOPE in a sustainable manner, policymakers must focus on promoting adoption of government voluntary health insurance by better targeting and increasing expenditure, while at the same time incentivising the private sector to increase their contribution towards healthcare.
*
The views expressed here are those of the author and do not represent the views of the ‘South Asia @ LSE’ blog, the LSE South Asia Centre or the London School of Economics and Political Science. Please click here for our Comments Policy.
This blogpost may not be reposted by anyone without prior written consent of LSE South Asia Centre; please e-mail southasia@lse.ac.uk for permission.
Banner image © Swarnavo Chakrabarti, 2021, Unsplash.
*


Does fall in OOPE also influenced by demography of population between the study periods? Younger generation unlikely to have more OOPE and recent introduction of Ayushman Bharat. There is as your article says significant rise in private health insurance even in middle class and upper middle class.