 Democracy only functions if elected officials represent the wishes of their constituents. But in a country with hundreds of millions of voters, and thousands of legislators, how can we measure how the policy preferences of constituents affect the actions of their representatives? Chris Tausanovitch argues that by aggregating and ‘bridging’ differing surveys, we can estimate liberal-conservative scores for voters, and legislative responsiveness for states, congressional districts, state legislative districts, and even cities.
One of the oldest and most important questions in political science is the question of how well legislators and other elected officials represent their constituents, and more broadly, how exactly the policy preferences of constituents affect the actions of representatives. Ask any wonk, politico, or casual follower of politics and they are likely to have an opinion about this question. So did many great political philosophers throughout history: Hobbes, Locke, Mill, Rousseau, Burke, and many others. Although almost everyone agrees that politicians do not (and most would say, cannot) adhere perfectly to the preferences of the people they represent, there is wide disagreement about the degree to which legislators are responsive and the type of political institutions that could foster better responsiveness.
Resolving these differences empirically is not easy. Some scholars have attempted to gauge responsiveness by asking legislators to evaluate themselves. Others have tried to deduce the degree and kind of responsiveness by following legislators closely and trying to see whether their actions seem to be motivated by the desires of their constituents. However, the most straightforward way to answer this question is to measure the policy preferences of voters—what they want their representatives to do—and to compare them to the policy actions of those representatives. This is easier said than done, but modern political science methods provide a path forward.

Thanks to outlets such as the political science blog the Monkey Cage, and general audience blogs like the Huffington Post, Pollster.com, and Nate Silver’s fivethirtyeight.com, many people are now familiar with the budding science of election forecasting. What many may not know is that statistical tools can be used to do more than give us up-to-the-minute “best guesses” about the outcomes of elections. They can also help us answer important questions about democracy. In the case of representation, we can aggregate surveys in order to measure the policy preferences of constituents, aggregate votes to measure the policy stances of legislators and other elected officials, and use modern statistical techniques to summarize and compare the two. But to do so, we need some tricks to overcome a few challenges.
The first challenge is that we need a way to summarize and measure political positions. Voters have a myriad of opinions and views on all sorts of policy issues, and so do legislators. Comparing every single one would not be feasible, and it would be hard to understand or explain the result. Luckily, political views tend to have a common and relatively simple structure in the United States. For most of the policy questions we ask in surveys, we can identify one response that we would think of as being more “conservative” and one that we would think of as being more “liberal.” That’s because these labels represent sets of issues that stem from similar values that are shared by wide swaths of the public. “Conservatives” tend to believe in free enterprise, limited government, and traditional values, whereas “liberals” tend to place more emphasis on equality, government solutions to national problems, and secular values. We can use this fact to aggregate answers to policy questions and give each voter or elected official an overall policy “score” based on how liberal or conservative their responses to many different kinds of questions are.
The second challenge is that national survey samples aren’t nearly big enough to measure the preferences of constituents in every district. We need minimum samples of a few hundred people in order to say anything about a particular population, whether it be the country as a whole, a particular state, or a congressional district. There are 435 congressional districts in the United States, so even if we only wanted sample sizes of 300 people in each congressional district, that would require a survey of 130,500 people. What if we wanted to examine the preferences of constituents in state legislatures rather than Congress? It would take a national survey of over 600,000 people to achieve a sufficient sample size in every state senate district. Unfortunately, no single political survey has a sample size that large. In order to get sample sizes that big, we need to combine respondents to a lot of different surveys. Here, however, we run into another problem. Different surveys ask different questions, so how should we compare the liberalism and conservatism of people who answer these entirely different surveys?
MIT Professor Chris Warshaw and I have solved this second problem using a simple trick, which some have dubbed “bridging”. In order to compare respondents from surveys that ask different questions, we run our own survey that asks all of the questions from all of the other surveys to a completely new set of respondents. This new survey doesn’t require a large sample: a national survey of 1,000 will do. We use this survey to establish the relationships between responses to different sorts of questions. This survey creates a “bridge” between all of the other surveys we want to use. For instance, say that one survey asks respondents whether they support an increase in the minimum wage and another survey asks whether the government should provide everyone with health care. How often is someone who opposes raising the minimum wage more conservative than someone who supports government-provided healthcare? By answering questions like this, we can establish a common liberal-conservative score for many different surveys. In our article, we achieved a sample size of 275,000, allowing us to estimate liberal-conservative scores for states, congressional districts, state legislative districts, and even cities. All of these different levels of government present opportunities to learn more about legislative responsiveness and how different institutions might affect it. In the future, sample sizes of 300 to 500,000 will allow us to learn even more.
So to what degree do elected officials represent their constituents? There are many subtleties to comparing the positions of representatives and constituents that go beyond the scope of this short blog post. What we can say is that at all levels of government, more liberal constituencies are likely to have more liberal representatives, and more conservative constituencies are more likely to have more conservative representatives.
Figure 1: Average liberal-conservative score for US cities and the percent of city revenue from sales taxes
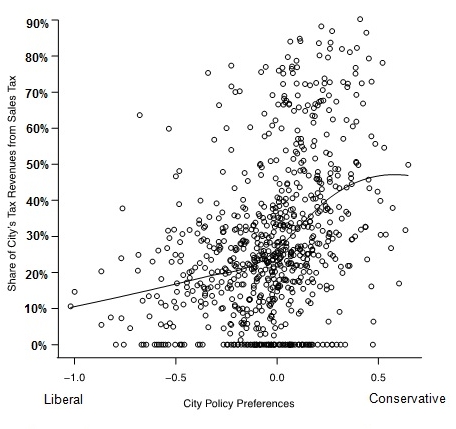
For example, Figure 1 above shows the average liberal-conservative score for cities in the United States, and the percent of the revenue that each of these cities gets from sales taxes. Each point on the graph is a different city. We might think that cities are a particularly tough case for representation because Americans often know very little about how their cities and towns are governed. Turnout is abysmally low, often in the 10-20 per cent range. Here we are focusing on a single policy that is related to the regressivity of the tax system—that is, how much of the tax burden of the city falls on the poor. Poorer individuals spend most of their income, so they pay more taxes when sales taxes are the main source of city revenue than when property taxes or income taxes are the main source of revenue. Conservatives tend to favor more regressive taxes over revenue sources that tax the rich more highly. What this graph shows is that more conservative cities (the ones on the right) do indeed get a much higher share of their income from sales taxes, and more liberal cities (the ones on the left) get much less of their income from sales taxes. Although there are a few liberal cities that get high shares of income from sales taxes, and a few conservative cities that get low shares from sales taxes, the trend on average is what we would expect if democracy were working. Deviations from the trend may have perfectly reasonable explanations. For instance, some states do not allow cities to levy income taxes, and others put limits on property taxes.
There are many different sorts of hypothesis that we can test about representation, and indeed, perhaps many types of representation. What we have done, is to develop some techniques to take the very first step of measuring some of the basic quantities of interest: the preferences of legislators and constituents. We have made these estimates available at our website, so other scholars can make use of them.
In our era of polarized politics, cynicism about the political process in America is widespread. Much of this cynicism is probably merited. However, this does not mean that politicians are free agents, acting completely outside the mandate of those who elected them. By bringing data to the question of representation, I hope that we can better understand when and why politicians deviate from their constituents’ wishes.
This article is based on Measuring Constituent Policy Preferences in Congress, State Legislatures and Cities in the Journal of Politics.
Please read our comments policy before commenting.
Note: This article gives the views of the author, and not the position of USApp– American Politics and Policy, nor of the London School of Economics.
Shortened URL for this post: http://bit.ly/16EbeOL
_________________________________
Chris Tausanovitch – UCLA
Chris Tausanovitch is an Assistant Professor at the University of California – Los Angeles. His research interests are in ideology, political representation, the United States Congress and political science methodology.