 Predicting election results is just as much an art as it a science, writes David Wasserman. He argues that in recent decades, new trends in many of the subjective factors of elections have emerged and forecasters need to take them into account. These include the increased importance of migration patterns, the tendency for voters to vote for the party over the person, and shifts in campaign financing away from individual candidates and towards large party committees.
This article is part of a collaboration with the PS: Political Science and Politics symposium on US Presidential Election Forecasting. Click here to read other posts in this series.
Over the past 30 years the Cook Political Report has been in business, U.S. politics has evolved dramatically, and by necessity, so has the business of political forecasting. During this time, the American electorate has clustered itself in increasingly polarized states, districts, and even neighborhoods. Voters’ willingness to vote for the “person” over the “party” has diminished considerably. And a rapid rise in political spending not directed by individual candidates has upended the campaign advertising landscape. As politics has evolved, so must we.
Our basic approach for predicting the outcome of 435 House seats, 100 Senate seats, and 50 gubernatorial offices has always been a mix of science and art. In assessing a race, we start with the “science:” What are the demographics and partisanship of the state or district? Is there an incumbent running? What are the prior election results? How much money has each candidate raised, and is there any public polling data available? These metrics provide a foundation for our analysis, but do not paint a complete picture.
https://www.flickr.com/photos/cedwardbrice/6561307467
Next is the “art,” the set of subjective factors that aren’t as easy to measure but must be put in context. Does the incumbent or challenger have particular positive biographical attributes, or crippling baggage? How effective are his or her ads likely to be? Will his or her background resonate with voters? Each election cycle, we personally interview more than 100 candidates to gauge their strength. We also constantly and discreetly communicate with a wide array of pollsters, media consultants, and party strategists to assess the state of play in each competitive race.
Each of these factors must be calibrated carefully when handicapping a race: sometimes a candidate’s flaws overwhelm all other reasons why he or she should win; other times, the partisanship of a district is destiny. But as the nature of elections has gradually yet profoundly changed, we have had to gradually recalibrate the weight we assign each of the “clues” we take into consideration when rating races on our seven point scale: Solid Democratic, Likely Democratic, Lean Democratic, Toss Up, Lean Republican, Likely Republican, or Solid Republican. Here are three of our “new rules:”
1) More than ever, migration patterns can determine which seats will switch parties: Over the last several decades, American voters have – whether subconsciously or not – chosen to live in communities where the majority of their neighbors agree with them politically. This self-sorting, compounded by partisan gerrymandering , has collapsed the number of “swing” House seats – seats we define as performing within five points of the national average in presidential elections – from 164 to 90 (a 45 percent decline) in the last decade:
Figure 1 – U.S. House Seats by Cook Partisan Voter Index Score, 1998-2014
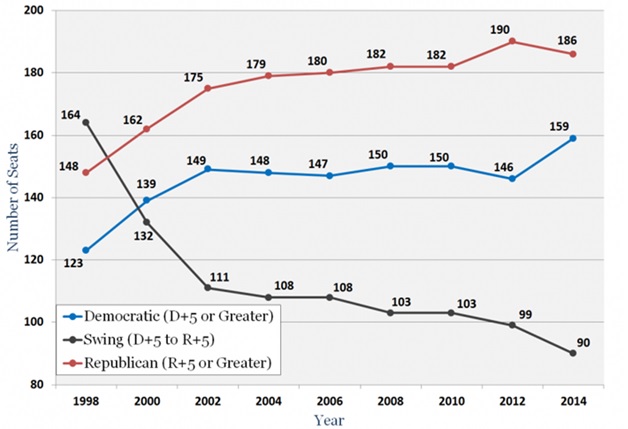
As more and more seats essentially become partisan cul de sacs, with the winner’s identity determined a primary rather than a general election, our focus has been on identifying the rare instances cultural and demographic shifts are making seats more competitive. For example, a steady influx of Latino and gay voters to the Palm Springs area made California’s previously safe Republican 36th District a ripe Democratic target in 2008 – and our focus on these migration patterns allowed us to alert our readers to a stunning upset ahead of time.
2) It’s harder to persuade today’s voters to value the “person” over “party:” It’s fashionable for voters to tell pollsters they vote for the “person” and not simply their party, but in reality, the share of voters willing to “split their tickets” – that is, vote for one party for one office and another party elsewhere on the ballot – has dropped to levels not seen in generations. In 1972, 44 percent of congressional districts favored one party nominee for president and the opposite party for Congress. In 1992, 23 percent of districts split their tickets, and in 2012, just six percent did. Just several years ago, a Democratic candidate with more money and a much stronger resume than his Republican opponent could easily win a Republican-leaning seat. Today, the gap in candidate quality and fundraising would have to be enormous for such a candidate to outperform his party’s presidential nominee by more than five points. As coverage of individual candidates and readership of local newspapers have declined, voters’ image of the national parties has taken over as the leading cue at the ballot box, creating less “localized” and more “nationalized” elections.
3) How much a candidate raises is a now a smaller piece of an expanding puzzle: It used to be that a candidate had to raise about $100,000 before she was taken seriously by her national party committee (for example, the National Republican Congressional Committee or the Democratic Congressional Campaign Committee), which would then agree to supplement candidate-driven ad spending with its own independent ads, usually in the form of attacks on her opponent. But party and Super Political Action Committee (PAC) spending has expanded into its own behemoth, capable of outpacing candidate spending in the most competitive races and obscuring candidates’ messaging. Between 1992 and 2012, according to Vital Statistics on Congress, candidate spending in Senate and House elections tripled from $523 million to $1.5 billion. But party committee spending rose fivefold from $46.1 million to $235 million, and “non-party independent expenditures” exploded 72-fold from $6.3 million to $457 million. As a result, news articles using candidate fundraising totals as a proxy for likelihood of winning are, in all likelihood, missing the mark. In the most competitive races, the proliferation of outside group spending means a modern candidate is just one of many actors on a crowded stage – and must run especially creative and well-targeted ads to “cut through the clutter.”
This article is based on the paper “Recalibrating Ratings for a New Normal,” appearing in the PS: Political Science and Politics symposium on US Presidential Election Forecasting. Click here to read the other posts in this series.
Featured image – Credit: dbking (Creative Commons BY)
Please read our comments policy before commenting.
Note: This article gives the views of the author, and not the position of USApp– American Politics and Policy, nor of the London School of Economics.
Shortened URL for this post: http://bit.ly/RNMSyF
_________________________________________
David Wasserman – Cook Political Report
David Wasserman is U.S. House Editor for the Cook Political Report, a nonpartisan newsletter analyzing presidential, congressional, and gubernatorial elections. Since joining the report in 2007, David has been responsible for handicapping each of the 435 races for U.S. House. His main research interests include geographical voting trends and redistricting. In 2011, he authored “Better Know a District,” the Cook Political Report’s comprehensive guide to the decennial redistricting process.