 When looking at environmental hazards, migration tends to be focused on as a result of disasters, rather than a contributor to community vulnerability. Using data from across the U.S. on hazards and county-to-county migration, J. Matthew Shumway finds that counties most at risk of experiencing severe and/or frequent environmental hazards are losing both people and income as a result of migration. He writes that counties with lower hazard levels are attracting migrants with higher incomes from those with higher hazard levels, and that this is decreasing their resilience to cope with hazards.
Within research on environmental hazards, migration is usually approached in terms of out-migration just before or during a hazard event and return migration once recovery has started. However, migration is also an important component in determining local, community levels of vulnerability and resilience to hazards. Migration can either increase or decrease community vulnerabilities by changing the size and composition of the local population.
In recent research we examined how migration varies among counties that experience significantly different exposures to all environmental hazards. We found that counties that experience the greatest impacts from environmental hazards are losing income as a result of both net outmigration as well as income loss through out-migrants having higher incomes than in-migrants.
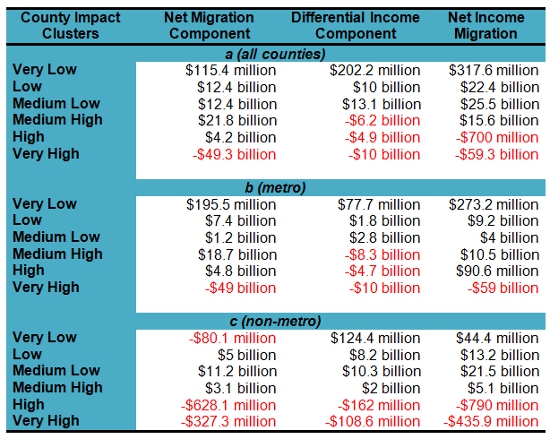
To investigate community vulnerability, we first created a hazard impact index (HII) using data from the University of South Carolina’s Spatial Hazard Events and Losses Database for the United States (SHELDUS), which tallies natural disasters by U.S. county. SHELDUS includes information on the frequency of hazards by type of hazard, the number of deaths and injuries, and damages in dollar amounts (which we don’t use in our index because of some quality issues). We use this information to create a weighted index of environmental hazards. The measures are standardized using Z scores and then weighted as follows: frequency 60 percent, deaths 15 percent, injuries 5 percent and a 20 percent state weight derived from the national average. We then assigned each county to one of six clusters according to the Z-score of its natural hazards index.
For the second part of the research we used a county-to-county migration data set created by the U.S. Internal Revenue Service (IRS). The IRS migration data matches up addresses from one tax year to the next and we use that data to determine differences in aggregate and per capita income between counties due to migration. Income from migration is disaggregated into two elements – change because of net migration (net effects) and change because of differences in income between in-migrants and out-migrants (differential income effects). We then compare aggregate income change by these two components across our HII groups.
Table 1 shows that counties at low risk for environmental hazards receive income from migration through both the effects of the increase in population and the differences between the incomes of immigrants and locals. The gains in income for most low risk clusters come from differential income rather than from net migration. This is important because it suggests that people with higher earning capacities are concentrating in lower risk areas. On the other hand, all three high-risk clusters lost income from differential income migration. This is particularly the case for the High-risk set of counties where losses from differential income were more than three times the losses from net migration. The Medium High cluster had an overall net aggregate income gain, but this was all from net migration. The Very High set of counties lost income from both net migration and differential income effects, but these losses were dominated by net out migration of income.
Table 1: Income Migration Components by County Impact Cluster and Metro Status
The principal finding suggests that counties most at risk to experience severe and/or frequent environmental hazards are losing both people and income as a result of migration. For those counties most at risk (Very High and High), income is lost through both a net loss of income through large numbers of net out-migration as well as income loss through out-migrants having higher incomes than in-migrants. However, it could be that what we are seeing is job growth taking place in less hazardous counties and people moving to take advantage of the growth in employment opportunities with the side benefit of being in a less hazardous location. There is not an easy way to disentangle these effects using the IRS migration data or without using more sophisticated methodologies than we are using here, nevertheless, to get a slightly clearer picture of what is going on, we reclassified all counties into a three-by-three matrix based on high, medium, and low hazard impacts and job growth. The job growth data comes from the Bureau of Labor Statistics.
Figures 1 and 2 show flows of aggregate and per capita income, respectively. A couple of patterns stand out. First, for aggregate income the flows move primarily right to left (low job growth to high job growth) and upward (more hazardous county clusters). This suggests that economic opportunities – as measured by growth in total employment – may be counteracting the effect of hazards on population and income redistribution. However, a deeper examination shows the low hazard/high job growth category gained aggregate income from every other group of counties—including the other two high job growth categories. The medium hazard/high job and medium hazard/medium job growth groups both received net aggregate income from their counterparts in the high hazard groups. By far the largest increases in aggregate income went to the high hazard/ high and medium job growth county groups, but most of these gains came from within the same hazard group or from lower job growth groups.
Figure 1 – Changes in aggregate income migration by hazard and employment categories
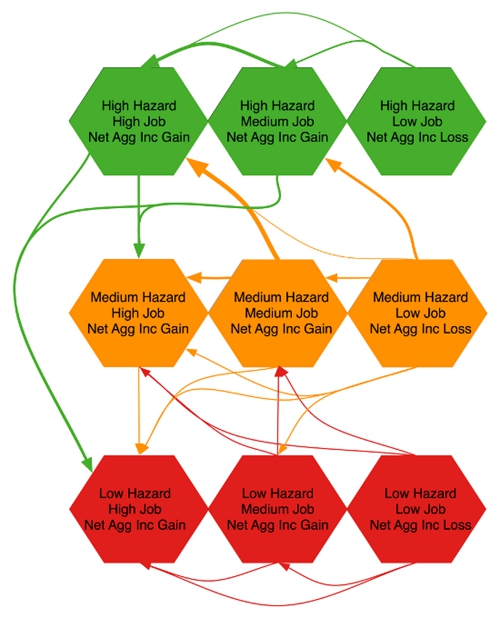
Figure 2 – Changes in per capita income migration by hazard employment categories.
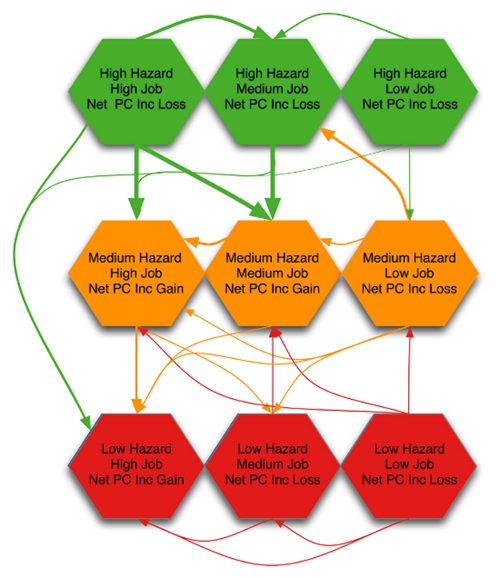
Note: PC = per capita
The patterns shown in Figure 2 for per capita income flows are quite different. For example, the high hazard/high job growth category “lost” per capita income to not only the less hazardous but high job growth groups but also to all three medium job growth county groups. In almost every case, per capita income “losses” were due to in-migrants having lower incomes than out-migrants and those losses were “gains” in per capita income of less hazardous counties. This finding suggests that counties with lower hazard impacts are attracting migrants with higher incomes and exchanging these with counties that have higher impacts from hazards, thus changing the spatial balance of vulnerability and community resilience to environmental hazards.
Shifts in both the total number of people and the loss of income associated with net migration implies that counties most at risk to experience environmental hazards are the very ones that can least afford the loss of income and if this is in fact what is occurring, it also means a possible divergence among counties in the ability to develop high levels of community resilience. Local communities involved in efforts to increase resiliency need to be aware of migration’s effects on levels of community vulnerability and include such information in their planning process.
This article is based on the paper Environmental Hazards as Disamenities: Selective Migration and Income Change in the United States from 2000–2010 in the Annals of the Association of American Geographers.
Featured image credit: Chris Wieland (Creative Commons BY NC ND)
Please read our comments policy before commenting.
Note: This article gives the views of the author, and not the position of USApp– American Politics and Policy, nor of the London School of Economics.
Shortened URL for this post: http://bit.ly/SKih4M
_________________________________
J. Matthew Shumway – Brigham Young University
J. Matthew Shumway is a Professor in the Department of Geography at Brigham Young University. His research interests include the causes and consequences of spatial mobility at micro and macro scales, and population, economic, & land-use changes in rural America.