 The financial crisis of 2007-2008 led to a significant fall in GDP in the US and the UK which took years to recover from and left a legacy of sluggish growth. In new research, Nicholas Snowden examines the lead up to the financial crisis, and traces its origins back to developments during the 1980s. He argues that after the mid-1980s, corporations began to prioritise shareholder returns above capital investment, and that this dearth of investment spending was offset by a consumer spending boom fuelled by lower interest rates, which in turn led to the financial meltdown.
The pre-eminent position of the UK and USA in global financial markets was to reveal a costly downside in the wake of the Lehman crisis. In the fifteen months following the peak of the crisis in early 2008, UK GDP fell by six percent. Its 2008 level was finally exceeded in 2014, but only by 3.4 percent. Though the US recovery was brisk on this comparison, with 2007 peak output recovered early in 2011, annual GDP growth has since averaged only a little over two percent.
This lacklustre recovery must be attributed substantially to inhibitions arising from debt-burdened, and crisis-aggravated, balance sheets in the household and banking sectors. But if the legacy of financial excess has acted as a brake on recovery, should the crisis itself be attributed primarily to the banking sector and to failures in its regulation? This has certainly been the focus of many diagnoses but I argue that the origins of the 2008 difficulties must be sought in US economic developments dating back to the early 1980s. The argument has parallels with explanations offered during the 1930s for the Great Depression.
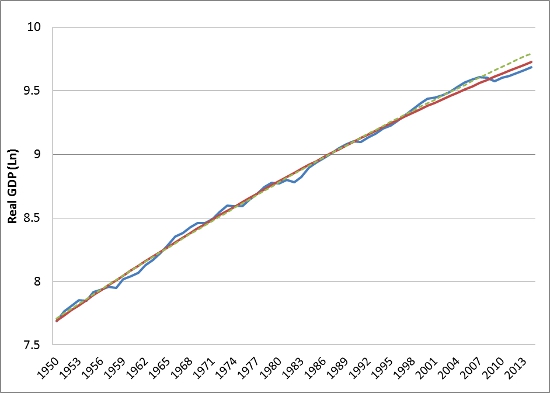
To introduce this alternative perspective, Figure 1 shows the path of US real and trend GDP (in natural logarithms) after 1950:
Figure 1 – US real GDP 1950-2014
Source: BEA Table 1.1.6
Although the vertical axis highlights discrepancies between the two series GDP evidently exceeded its (solid) trend in the decade following 1998. Equally clear is that six years after the 2008-09 disruption the economy has yet to regain its long-term trajectory. The suspicion that this persistent shortfall may be connected with the sustained boom after 1998 is further strengthened by reference to monetary developments. After the dot.com collapse in 2001 official interest rates had fallen to one percent by early 2004. By uncovering the financial fragility that these earlier low rates had encouraged, their subsequent rise to over five percent in late 2006 clearly contributed to the financial meltdown that followed.
Before accepting a popular conclusion that monetary policy was the villain of the piece, however, the post-1998 decade deserves further scrutiny. The claim that the Fed prolonged the boom ‘artificially’ after 2001 is challenged by an absence of the inflationary pressures normally associated with monetary excess. Indeed, Figure 1 probably exaggerates the post-1998 boom. Estimated over the years 1950-2008, the alternative (dashed) trend excludes the subsequent ‘Great Recession’ experience. It suggests that the vigorous monetary accommodation after 2001, and the debt-fuelled consumption boom that it was to stimulate, served merely to support the previously long-established rate of economic expansion (2.6 percent per annum).
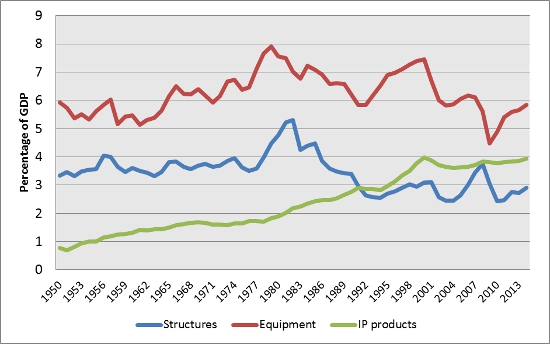
Although the projection of this growth rate to 2014 suggests a recent actual GDP shortfall of around nine percent (against only four percent for the solid trend) the exaggeration may not be great. Industrial capacity utilisation is estimated officially to have been approximately six percentage points below its 1994-95 peak in 2014. If the pre-2008 consumption boom masked an incipient weakness in aggregate demand, therefore, the inability since of extraordinary monetary measures to achieve more than a sluggish recovery has prompted concern over secular stagnation. The evidence in Figure 2 suggests that such tendencies may have been in development since the 1980s:
Figure 2 – Business capital expenditures
Source: BEA Table 1.1.5
Following a marked rise in the share of equipment investment in GDP during the late 1970s, there are signs of a declining trend in the ratio afterwards. The ‘new economy’ boom of the 1990s appears to have been an interruption of this longer-term tendency, with its nature indicated by the coincidence in 2000 of peak ratios for both equipment investment and for expenditures on intellectual property products (including software). Whatever the technical merits of much of this spending, its positive macroeconomic consequences are indicated in Figure 1 by the strength of GDP during the later 1990s.
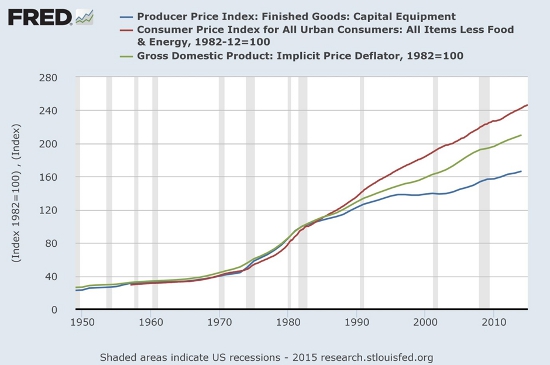
The relative decline in capital formation after 2001, especially in equipment investment, is apparent in Figure 2. It also provided some of the impetus for the contemporary measures of monetary stimulation. Underlying weakness in corporate capital expenditures emerges, therefore, as the ultimate source of the 2008 crisis. Why, though, did the weakness arise? Three secular factors can be identified with the simplest being a declining tendency in relative prices. Figure 3 reports that equipment prices lagged both consumer prices and the overall GDP deflator, especially from the mid-1990s:
Figure 3 – Comparative price indices
Source: FRED
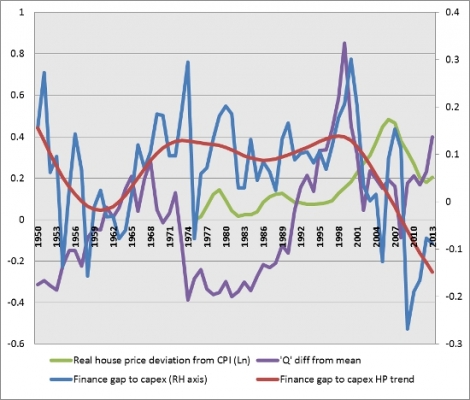
Such a large relative decline in the cost of equipment ‘should’, of course, have provided the inducement for a much higher rate of investment activity. Two further secular factors are therefore required to explain why this did not occur. The first may be traced to the peak investment ratios of the late 1970s that were observed in Figure 2. This peak is especially evident when gauged by corporate financial resources, rather than by GDP. The dashed series in Figure 4 (with accompanying Hodrick-Prescott trend) reports corporate gross capital expenditures minus the sum of retained profits and the capital consumption allowance (the ‘financing gap’), expressed as a fraction of gross capital formation:
Figure 4 – Corporate ‘financing gap’ 1950-2013
Source: FRB Z1, Definitions (re Figure 1)
High investment spending in the 1970s coincides in Figure 4 both with a comparatively large financing gap and with weak stock market valuations (the ‘Q’ measure). This weakness, in turn, reflected poor investment returns and a slump in dividend pay-out ratios. Similarly, the gradual recovery in equity prices from the mid-1980s coincided with rising pay-outs and a sharp decline in new share issues. The suggestion that corporations were beginning to prioritise shareholder returns over capital investment is consistent with historical evidence. It was this objective to which executive compensation, with the apparent exception of the dot.com episode, was subsequently to be oriented. Shareholders were beginning to demand returns that many new projects were considered unable to provide.
It is against this background that the striking feature of Figure 4 becomes apparent. Following the NASDAQ reversal of the share price (‘Q’) measure in 2001, and the growing weakness of corporate investment spending in relation to available funds, the (relative) house price index begins to strengthen appreciably under the influence of monetary relaxation. The consumer boom provided an offset to a comparative investment spending dearth.
Although corporate capital spending is now recovering after a long period of weakness, a final secular consideration suggests that incipient demand deficiency may continue to pose policy dilemmas. Manufacturing employment fell by nearly six million between 1998 and 2010, whereas two service sectors alone (health and social) added approximately four million workers. The trend to service sector employment raises the possibility that a part of the recent weakness in business capital spending reflects an ongoing shift to activities with an inherently lower capital requirement per worker.
To the extent that the 2008 crisis revealed the limits of monetary stimulus, the analysis clearly favors fiscal inducements to private capital spending, as well as greater public infrastructure investment. It is a misfortune that policy in both countries has tended to move in the opposite direction.
This article is based on the paper ‘What really caused the Great Recession? Rhyme and repetition in a theme from the 1930s’, in the Cambridge Journal of Economics.
Featured image credit: MyEyeSees (Flickr, CC-BY-NC-ND-2.0)
Please read our comments policy before commenting.
Note: This article gives the views of the author, and not the position of USApp– American Politics and Policy, nor of the London School of Economics.
Shortened URL for this post: http://bit.ly/19kHydS
______________________
 Nick Snowden – Lancaster University Management School
Following his recent retirement from full time employment, Nick Snowden is currently a Visiting Fellow in Economics at Lancaster University Management School. He specialises in postgraduate teaching in the areas of international finance and banking. Nick’s early research interests focused on the international banking crisis of the early 1980s and his book Emerging Risk in International Banking has recently been reissued by Routledge (2012). Nick’s later research concentrated on linkages between global capital markets and the emerging economies. More recently his interests have incorporated exploration of the parallels between early diagnoses of the Great Depression and the global macroeconomic difficulties of 2008.


