 Past research has argued that over the last 30 years, the United States has become much more geographically polarized. Democrats and Republicans, the argument goes, are moving to different locations, creating a society in which voters are unlikely to know anyone who has an alternative perspective on politics. But how much have Americans really polarized over the last 30 years? In new research which utilizes data on presidential voting by county from 1972-2012, Corey Lang and Shanna Pearson-Merkowitz find that while partisan sorting is on the rise, it is a fairly recent phenomenon, which appears to be mainly driven by the Southern realignment and not housing decisions.
For the past two decades, the presidency and both houses of Congress have been hotly contested by the two political parties. Yet geographically, the United States seems to be increasingly marked by “Red” areas where the Democratic Party lacks any ability to even dream of winning office and “blue” areas where the Republican Party lacks enough electoral support to produce viable candidates. By many journalistic accounts, people are more and more likely to live around only members of a single political party and as a result they lack exposure to alternative views. But despite journalists’ concerns over the political segregation of America, we know very little about how much our neighborhoods have actually changed and whether this is a new event or just a return to the norm for American politics.
There are also two possible reasons that America may appear to be more politically segregated than in the past. The first reason, argued by Bill Bishop in his book “The Big Sort”, is that people are increasingly choosing their neighborhoods based on criteria that correlate highly with political preferences. This argument suggests that political segregation is a product of the movement of voters between neighborhoods—as kids grow up and move out of their parent’s homes, their subsequent choice of housing increases the political homogeneity of the American neighborhood. Democrats move to areas dominated by coffee shops, diversity, and walkability and Republicans move to areas dominated SUVs, Box stores, and few people of color.
However, there is also another possible reason for a more politically segregated America. The United States went through what scholars call a “political realignment” in the lead up to and following the Civil Rights Act that rocked what it meant, ideologically, to be a “Democrat” or a “Republican”. By the 1970s, journalists and academics alike bemoaned the apparent meaninglessness of the two political parties. As a result of partisan change it was very difficult for voters to align their ideological beliefs with their choices in candidates. Voters had lots to choose from—Liberal Republicans, Conservative Republicans, Liberal Democrats and Conservative Democrats. According to some political scientists, older voters, who were socialized when the Democratic Party was the party of segregation and slavery continued to vote for Democrats even after the party started to change its tune on the issue, but new voters were socialized during presidential campaigns in which the Democratic Party was the party of civil rights and the Republican Party was the party of the free market and religious and racial conservatism. As a result, new voters identified with the opposite party of their elders even though they held the same views. Many Republican strongholds of the 1960s were fairly liberal and stayed that way, but overtime they stopped voting for liberal Republicans and started voting for liberal Democrats just as other places were conservative in the 1960s and still are today but they switched from voting for conservative Democrats to conservative Republicans. This is a process that some scholars call “generational replacement” after a realignment or “partisan sorting”. The idea is that the political parties switch position, but it takes time for voters to line up correctly. As voters are in the process of realigning, areas can appear to be politically diverse even when they are ideologically homogeneous because the electorate is not well-aligned with the positions of the political parties.
We set out to examine if the extent to which the United States has become more politically segregated and to see if we could isolate what factors have contributed to this sorting. We used data on presidential election results by county from 1972-2012 and controlled for many confounding factors, including the racial and economic demographics of the residents in the county to make sure that what we were measuring was a change in the partisanship of the residents and not just a change in the demographics of the county. We also incorporated data from the Internal Revenue Service on the number of people moving in and out of each county between elections in an attempt to measure if increases in geographic polarization were due to voters moving to more likeminded areas.
Our results indicate that partisan sorting is on the rise, but that it is a very recent phenomenon. In the 1970s and 1980s, counties tended to become more competitive, but by 1996 a pattern of partisan sorting had emerged and has continued through the present. Our results also suggest that this pattern is driven by Southern re-alignment and voting behavior in counties that leaned heavily in one direction already indicating that places that were already geographically polarized are becoming more so. Lastly, we find evidence that migration does drive partisan sorting, but only accounts for a small portion of the change and only in recent elections.
Figure 1 shows the changes that four sample counties went through since our data begins in 1972. Each has experienced a different level of partisan change. Because some presidential races in this time period were close and some were landslides, we think about how Republican or Democratic a county is relative to the national vote. For example, in 2012 Barack Obama received 53.8 percent of the popular vote. If a county voted 60 percent for Obama and 40 percent for Mitt Romney, this county would be 6.2 percent more Democratic than the national average.
Howard County, Maryland appears to fit the concerns of journalists about the geographic polarization of the United States. From 1972 to 1996, Howard County appears very politically competitive. But after 1996, the county appears to become far more Democratic than the country as a whole. But De Kalb County, Georgia tells a different story. De Kalb voted considerably more Republican than the country as a whole in 1972. But in the following elections De Kalb begins to change and there is a steady movement towards the Democratic Party until 2012 when 77.63 percent De Kalb County voters cast their ballot for Barack Obama. Pasco County, Florida on the other hand, voted overwhelmingly Republican in 1972, and then entered a period of relative political diversity until the contested 2000 Presidential election. Since then, the county has steadily moved toward the Republican Party. Woodbury County, Iowa would appear to have become more competitive over time, but it would depend upon which year one used as their starting point. When looking at the county across time, it is clearly competitive throughout the timespan.
Figure 1 – Partisan change in four sample counties, 1972-2012
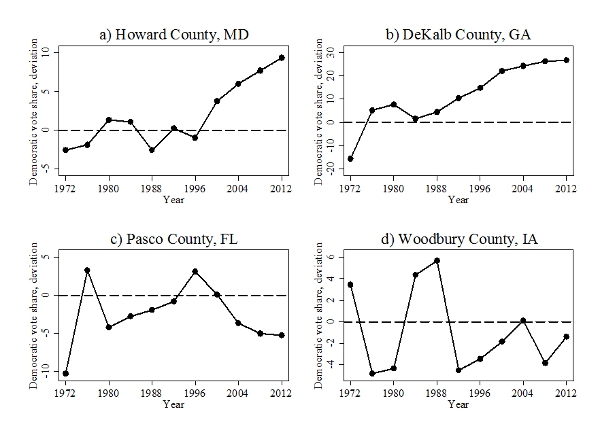
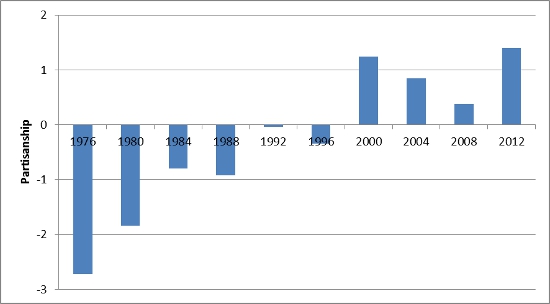
Figure 2 shows the average change in county-level partisanship from the prior election based on our model of partisan change in the United States. Here we have modeled the average change using a county that voted 60 percent for one party in the first election in the time series (1972) to exemplify the change that our model predicts. Negative numbers indicate that counties became more politically diverse and positive numbers indicate counties became more politically polarized. For example, Figure 1 shows that a county that voted 60 percent Republican in 1972 would be expected on average to vote 57.3 percent Republican in 1976. In more recent times, our results suggest that a county that voted 60 percent Republican in 2008 would be expected on average to vote 61.4 percent Republican in 2012.
Figure 2 – Average change in partisanship from prior election by County
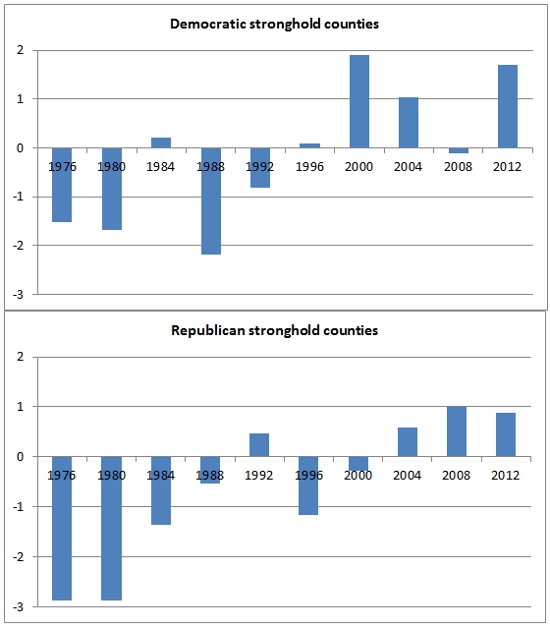
Our results indicate that places that lean towards one party are the places that are driving geographic sorting. That is, places that already favored one party by a large margin became even less competitive, while counties that were competitive have largely remained so. Figure 3 presents our results when we separately examine how voting has evolved in Democratic stronghold, Republican stronghold counties, and competitive counties. (We define a Democratic stronghold as having a Democratic share of votes 0.4 standard deviation above the national average, and define Republican stronghold similarly. This cutoff makes roughly one-third of counties Democratic strongholds, one-third Republican strongholds and one-third well contested.) In general, we find similar patterns in both of the partisan stronghold counties but not in the competitive counties. In the 1970s-1990s, partisan counties did tend to become more politically heterogeneous but during the 2000s, these counties trended more toward their favored party in each election. The shift towards polarization seems to have occurred earlier in Democratic stronghold counties, beginning in 1992, whereas in Republican dominated areas, the shift began on average following the 2000 election.
Figure 3 – Average change in partisanship from prior election for Counties leaning toward one party in 1972
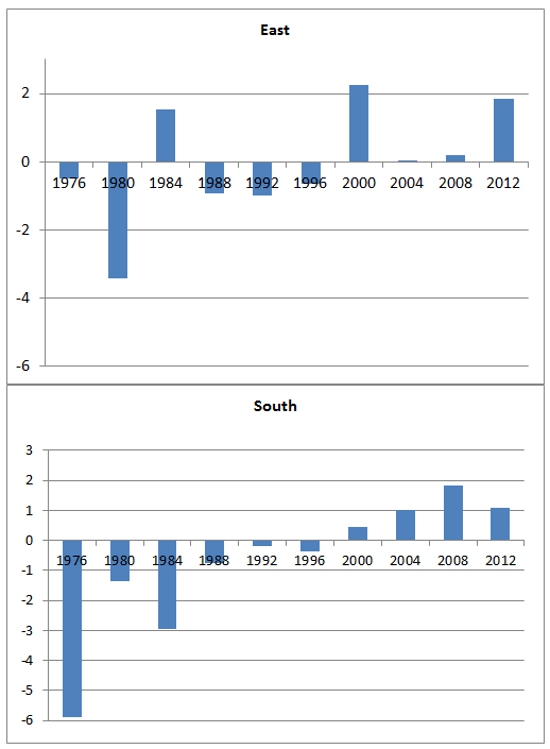
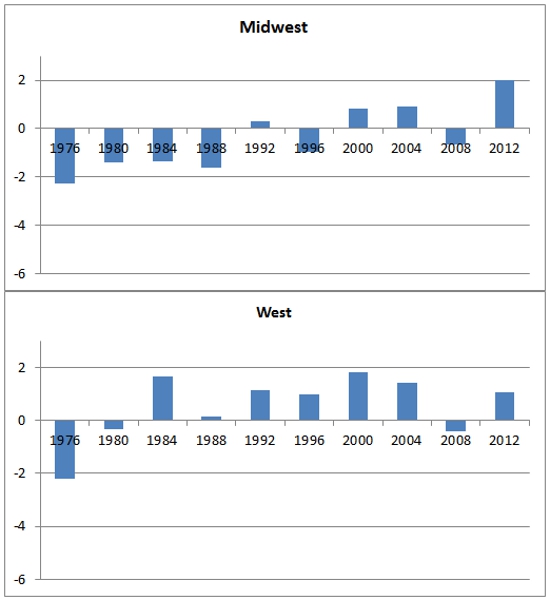
The South has been undergoing a political realignment for many decades, so we investigated how much of our results were driven by counties in the South. Figure 4 presents our results when we separately examine how voting has evolved in each of the four regions of the United States. In general, we find similar patterns in all four regions—periods of increasing political diversity followed by increasing homogeneity. However, this trend is most pronounced in the South, where our data suggest the South appeared to be getting much more heterogeneous before entering a trend toward one-party dominance. This timeline fits with existing data on the realignment of the South.
Figure 4 – Average change in partisanship from prior election by geographic region
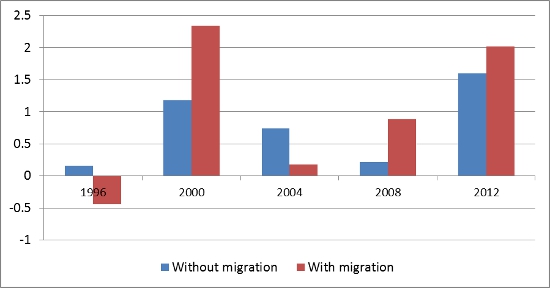
We next investigated the extent to which the trend toward political diversity and then political segregation was driven by the movement of voters to new destinations. Our results suggest that migration between counties made places more politically diverse up until the 2000 election. But following that election, voter migration does appear to be leading to a greater level of geographic polarization. However, the magnitude of the effects is relatively small. As Figure 5 shows, in-migration certainly increased geographic polarization after 1996 in counties that favored one party, but these counties also became more homogeneous even without new voters moving in.
Figure 5 – Change in Partisanship due to new residents (migration) and without new residents
We see our data as suggesting that the country has begun to “sort” into more politically segregated counties but that the evidence does not fit the timeline suggested by existing accounts. Instead we find evidence that until 1988 counties that swung for one party over another either became more heterogeneous or switched parties in the following election. However, in 1996 the country began a steady shift toward geographic polarization. This timeline suggest that the increasing political homogeneity of the American neighborhood is more likely driven by partisan realignment and the culmination of other political events that have made it easier for partisans to line up their ideology with their choice of candidates at the ballot box than voter decisions about where to live. However, we also find evidence that particularly in the last decade, voters decisions about where to live are driving political polarization.
This article is based on the paper, ‘Partisan sorting in the United States, 1972-2012’, in Political Geography.
Featured image credit: Michael Coghlan (Flickr, CC-BY-SA-2.0)
Note: This article gives the views of the author, and not the position of USAPP– American Politics and Policy, nor of the London School of Economics.
Shortened URL for this post: http://bit.ly/1OECgNp
_________________________________
Corey Lang – University of Rhode Island
Corey Lang is an Assistant Professor in the Department of Environmental and Natural Resource Economics at the University of Rhode Island. His research interests include non-market valuation, energy, and climate change.
Shanna Pearson-Merkowitz – University of Rhode Island
Shanna Pearson-Merkowitz is an associate professor at the University of Rhode Island. Her academic work has been published in the Journal of Politics, the American Journal of Political Science, State Politics and Policy Quarterly, and elsewhere. Prior to entering academia, she worked in state and local government and electoral campaigns.