


 In new research, Giorgio Canarella, Luis A. Gil-Alana, Rangan Gupta and Stephen M. Miller look at trends in UK and US house prices going back more than 150 years. While on the surface house price trends on both sides of the Atlantic look quite similar, by using a new modelling technique, they find that there are considerable differences. Compared to the US, house prices in the UK, they write, are more likely to be affected in both the short and in the long term by unexpected economic events such as the Great Recession.
The financial crisis of 2007-2009 underscored how important it is to understand what drives house prices and their key role as a major driver of what happens in the wider economy. In his 2008 book, The Subprime Solution, Yale economist, Robert J. Shiller claimed that the housing bubble of the mid-1990s was the major, if not the only, cause of the sub-prime mortgage crisis and the worldwide financial crisis of 2007–2009. Others have found evidence on the role of house prices in causing the Great Depression, and that in the US, “housing is the business cycle.” Policymakers recognize that any weakening of the housing sector is a “downside risk.”
One important issue is around how house prices move up and down over time. We want to know if these prices tend to move back towards their historic average after an unexpected event in the economy – what economists call a ‘shock’. Do they generally stay away from their historic average after a shock – as stock prices do – or do they return to their average levels (also known as “reverting to the mean”), which would suggest that shocks have short-lived effects. If house prices tend not to revert to the mean, then this implies that they are hard to predict and to control. Some previous studies have found that house prices in the UK and the US do not return to their average after an economic shock, staying higher or lower, while others find that they do go back to their average.
In new research, we use a new method (called fractional integration) to examine changing patterns in short and long-term house prices in the US from 1830 to 2016 and for the UK from 1845 to 2016. Our datasets are the longest available annual information on home prices in the US and the UK. Our work suggests that US and UK home prices do not change in the same ways over time.
This result is unexpected, since others have previously argued that no “transatlantic divide” exists between the two markets, where the metaphor signifies the presence of major differences between the two markets. We find, however, that US and UK home prices follow a pattern of structural breaks that take place at different times and that the trends which are similar along the cycle of house price rises and falls are less common than the differences. This opens a new perspective on modeling and forecasting home prices that so far has been ignored.
“for sale” by nathan esguerra is licensed under CC-BY-2.0
How house prices have changed across three centuries
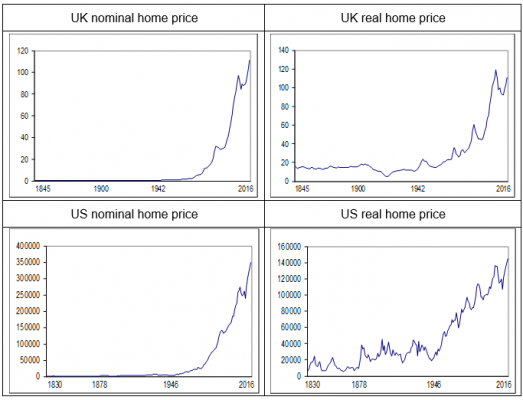
Figure 1 plots the US and UK house prices adjusted for inflation (‘real’) and not (‘nominal’). The historical development of the US nominal price does not appear to differ in any significant way from that of the UK nominal price. Both series display no pattern until the early 1950s. Since then we can see a strong upward trend emerges across all four sets of house price data. The evolution of the US real home price appears to be more volatile than the UK real home price, with more ups and downs. The real estate bubble, where home prices peaked in early 2006, declined in 2006 and 2007, and reached new lows in 2012, is pronounced in both countries. The UK price appears to experience longer swings than the US price.
Figure 1 – Nominal and real US and UK home prices over time
Our research uses three different models to describe the characteristics of the data. One of these suggests that more than 150 years of US and UK data shows that shocks to home prices in the US and the UK do not generate permanent effects on the trend or on the cycle. Beyond that, some significant differences remain between both markets: our modelling suggests that compared to US house prices, UK prices take longer to revert to the original equilibrium after a shock. In the US, a cyclical shock is short-lived, while in the UK, the effect is long-lived.Real and nominal home prices increased in both the UK and the US over the periods we examined. Between 1845 and 2016, UK home prices grew at an average annual rate of 3.8 percent in nominal terms and 1.1 percent in real terms. By comparison, between 1830 and 2016, US home prices grew at an average annual rate of 3.5 percent in nominal terms and 1.7 percent in real terms.
Milestone changes in house price patterns
Our work also looks at the issue of structural breaks – essentially when what’s driving changes to house prices alters significantly. Interestingly, while the home price swings associated with the Great Recession may seem dramatic today, the greatest structural changes in the overall dynamics of US and UK home prices took place much earlier, in the late 1970s and early 1980s in the UK, and in the mid-1950s and early 1970s in the US. The fact that these changes took place at different times shows that not only are house price dynamics different in both countries, it also signals that national, rather than global or common events played an important role.
For the US, the break dates occur at 1955 and 1972 for real and nominal prices, respectively, and roughly link with the major post-World War II developments in US housing policy. These developments include the National Housing Act of 1949, which expanded the federal role in mortgage insurance; the 1955 Amendment to the National Housing Act of 1949; the Housing and Urban Development Act of 1965, which produced major revision of the US federal housing policy and instituted several major expansions in federal housing programs as part of President Johnson’s “Great Society” programs; and the Housing and Urban Development Act of 1968, which created the Government National Mortgage Association. Together, this legislation helped millions of Americans to realize the “dream” of homeownership.
For the UK, the break dates occur at 1976 and 1983 for real and nominal prices, respectively, and roughly associate with important national macroeconomic events, such as the Secondary Banking Crisis of 1973-1975, the deep recession of the early 1980s, the large escalation in interest rate and inflation in the late 1970s and early 1980s, and, most importantly, the Labour Party’s income policies.
Structural breaks in house prices affect how we model how they change cyclically – i.e. in the short-term – and in the long run. An important result, common to all our samples, finds that long-run persistence plays a greater role than cyclical persistence in explaining the dynamics of home prices in both countries. In no instance, however, are the effects of shocks permanent.
Shocks affecting house prices in the long run persist for a longer time in the UK, while shocks affecting the cyclical component will die out sooner in the US. Long-run persistence is not a “transatlantic” phenomenon as it matters more in the UK than in the US. Cyclical persistence is not a “transatlantic” phenomenon either, as it matters mostly in the UK. For the same reason, the differently timed behavior of the structural breaks is not a “transatlantic” phenomenon. Thus, the “transatlantic divide” may still exist. While historic trends in US and UK home prices may look similar, digging down into the data shows that there are many differences.
Despite the similarities, the differences between US and UK home prices remain abundant, although not immediately evident from the data at first glance.
- This article is based on the paper, ‘Persistence and Cyclical Dynamics of US and UK House Prices: Evidence from Over 150 Years of Data’, in Urban Studies.
Please read our comments policy before commenting.
Note: This article gives the views of the author, and not the position of USAPP – American Politics and Policy, nor the London School of Economics.
Shortened URL for this post: http://bit.ly/3aIRdLQ
About the authors
Giorgio Canarella – University of Nevada Las Vegas
Giorgio Canarella currently works at the Center for Business and Economic Research (CBER), University of Nevada, Las Vegas. Giorgio does research in International Economics, Financial Economics and Econometrics.
Luis A. Gil-Alana – University of Navarra
Luis Alberiko Gil-Alaña is a Faculty Fellow of the Navarra Center for International Development and Professor of Econometrics and Quantitative Methods in the School of Economics and Business Administration at the University of Navarra.
Rangan Gupta – University of Pretoria
Rangan Gupta is a Professor at the Department of Economics, University of Pretoria, South Africa. His academic interests are mainly Monetary Theory and Policy, and Time Series Econometrics.
Stephen M. Miller – University of Nevada Las Vegas
Stephen M. Miller is Professor of Economics at the University of Nevada, Las Vegas. His research interests span monetary, macroeconomic, and international finance theory and policy; economic growth empirics; financial institutions; and real estate lending.


Isn’t comparing the UK to all fifty states in USA analogous to comparing a car battery to a sponge? – the population density of Wyoming alone skews comparison with the UK. Other states like Ohio have been bleeding population for decades. It is difficult to find even one state in USA that compares well to the UK’s population demands for housing and subsequent impact on real estate prices. The most comparative state in USA with the UK would be California, yet the UK is 2/3 its size with 20 million more people. So, yes, there is little in common between trends for housing prices in the UK and USA.