

 The leading US firms in many industries have increased their national market share substantially over the last four decades – making these industries more concentrated. But locally the picture is more complex. David Autor, Christina Patterson and John Van Reenen show that while the local concentration of sales in the US has also risen, the concentration of local employment has fallen. These divergent trends are driven by the same underlying economic factor: the shift from manufacturing to services.
The growing heft of large “superstar firms” in the US economy has spurred concerns that rising concentration may harm consumers and workers. New regulations and laws have been proposed and implemented, such as President Biden’s “whole of government” executive order on promoting competition and the European Union’s Digital Market Act.
Concentration is not the same as market power – firms can gobble up market share by offering great products at low prices. But neither can we assume that the rising extent to which a small number of firms account for a large slice of aggregate revenue and jobs is intrinsically benign. Understanding what is happening and why is critical for evaluating any policy responses.
Our earlier research focused on concentration across the whole of the US. We have used comprehensive US Economic Census data to document that national concentration rates rose across a swathe of industries between 1982 and 2012 (Autor et al, 2020). But in many industries, product and labour market competition are much more localised. Consumers cannot cross state lines each morning to buy the best cup of coffee, and workers cannot realistically mount nationwide searches for the highest-paying barista job. Indeed, job search is particularly likely to be highly localised for younger and less-educated workers, and for members of dual-earner couples facing the two-body problem. In new work, we employ the recently released 2017 Economic Census to investigate concentration over a longer period of time and at both the national and local levels. Consistent with other studies , we find that employment concentration has fallen at the local level, even though it has risen nationally. In contrast, we find that sales concentration has risen at the local level, just as it has at the national level. This latter finding is distinct from some earlier studies, which is likely to reflect the higher precision of the confidential US Census Bureau data used in our analysis.
Our analysis documents that the driving force behind these trends is the reallocation of about one in 10 jobs away from manufacturing and towards services since 1992 – a substantial “structural transformation”. Because manufacturing is far more locally concentrated than services, this reallocation drives down the overall concentration of jobs. Simultaneously, within each industry in a county, the concentration of both sales and employment has on average increased. This increase in the concentration of sales overwhelms the de-concentrating force of structural transformation. But in the case of employment, the opposite occurs – the number of employers in a local area becomes less concentrated
Concentration levels
We update our previous work by reporting average national concentration levels up to 2017, five years beyond what was available in our 2020 study. We find that regardless of how concentration is measured (using the top four or top 20 firms; or using sales or employment), national concentration has risen over the last 35 years.
Pooling data across all six sectors – manufacturing, services, finance, retail trade, wholesale trade, and utilities and transportation – Figure 1 documents trends in the national concentration of employment and sales. Because data on two of these six sectors – finance, and utilities and transportation – are not consistently available prior to 1992, we focus here on the period from 1992 to 2017.
Figure 1 – National concentration for employment and sales
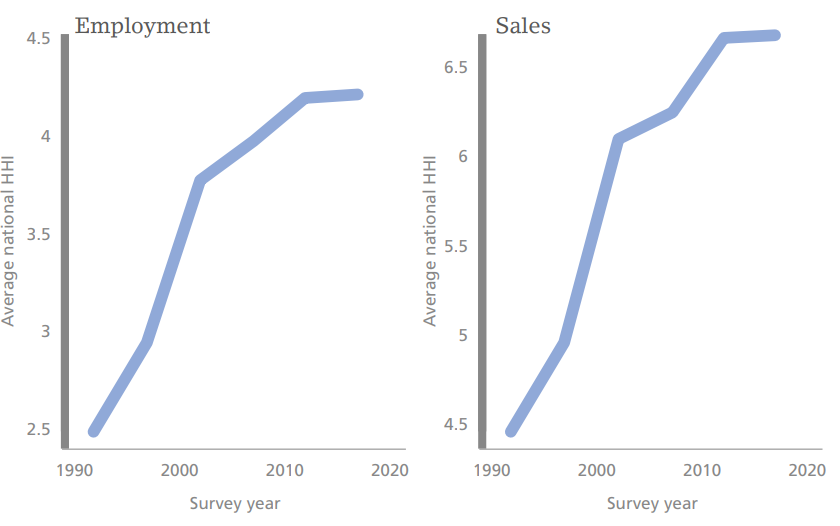
Notes: Figure plots the national HHI for employment and sales based on six-digit NAICS industries. In the left-hand panel, industries and sectors are weighted by their employment share each year, and in the right-hand panel, they are weighted by their sales share each year. For ease of reading, we have scaled the HHI such that the theoretical upper bound of ‘complete monopoly’ would be 100 (rather than 10,000 as is often used in antitrust practice).
We next turn to local rather than national concentration, which we measure using the same Herfindahl concentration index (HHI) but now calculated at the level of county and by using the six-digit North American Industry Classification System (NAICS) to distinguish industries. The left-hand panel of Figure 2 shows that employment concentration (blue line) has fallen at the local level whereas it rose at the national level in Figure 1.
Figure 2 – Local concentration for employment and sales
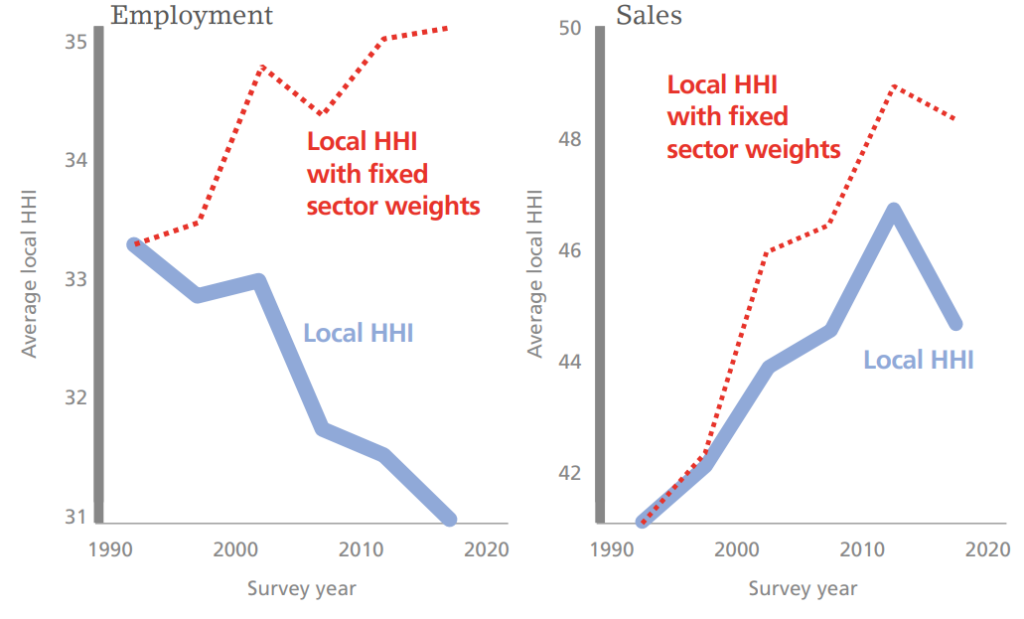
Notes: Figure shows the economy-wide local concentration for employment and sales across six-digit NAICS industries by county cell. In the left-hand panel, local HHIs are weighted by industry-county employment shares each year, and in the right-hand panel, they are weighted by industry-county sales shares each year. In the red lines, each sector’s weights are fixed at their 1992 level. For ease of reading, we have scaled the HHI such that the theoretical upper bound of ‘complete monopoly’ would be 100 (rather than 10,000 as is often used in antitrust practice).
What explains the divergent trends of rising national employment concentration and falling local employment concentration? We calculate how concentration would counterfactually have evolved had the employment shares of the six sectors remained fixed at their 1992 levels.
The red dashed line in Figure 2 shows that employment concentration would have risen at the local level, just as it did at the national level. This tells us that the structural transformation of economic activity over this period – with the employment share of manufacturing falling by 10 percentage points and the employment share of services rising by an almost identical amount – can fully account for the fall in employment concentration. Indeed, Figure 2 shows that employment concentration is rising within industries at county level; it is only the countervailing force of sectoral reallocation that prevents it from rising on average.
The right-hand panel of Figure 2 implements the same exercises for sales concentration. The blue solid line shows that sales concentration has risen at the local level, just as it has at the national level. When we hold sector weights constant at their initial levels (the dashed red line), the implied rise of local sales concentration is even higher.
Thus, sectoral transformation has worked against the rise in local concentration in both employment and sales. But structural transformation has had a smaller offsetting effect in sales than employment because the 7 percentage point reallocation of sales from manufacturing to services is smaller than the 10 percentage point reallocation of employment.

Policy implications
The policy implications of these changes are nuanced. For scholars and policy-makers worried about the trend of rising national sales concentration, the news that local sales concentration is rising in parallel with national concentration provides further cause for concern. If on the other hand, one views rising concentration as reflecting the virtuous reallocation of market share from less to more efficient firms, our findings convey further good news.
For those who read employment concentration as an indicator of higher monopsony power, the aggregate fall in local employment concentration could be regarded as good news: a young worker placed at random into a job in today’s labour market faces on average a less concentrated set of employers (by industry within each county) than three decades ago.
But this viewpoint may be too sanguine. Consider a mid-career manufacturing worker possessing extensive industry skills and experience. Because this worker cannot readily switch to a new line of work without taking a large pay cut, the net effect of industrial transformation may be less vigorous competition for their services.
Concentration is not the same as market power. Firms may loom large relative to their sectors precisely because they compete so effectively. Still, the history of antitrust is littered with powerful firms that began life as upstart competitors only to become competition- stifling incumbents.
Whether the trends in local sales and employment concentration here bode well or ill for economic dynamism, the powerful undercurrent of structural transformation is a neglected source of the seismic changes that we document. Understanding the impact of these structural trends on worker and consumer wellbeing should be a priority for future research.
- This article summarises ‘Local and National Concentration Trends in Jobs and Sales: The Role of Structural Transformation’ by David Autor, Christina Patterson and John Van Reenen, CEP Discussion Paper No. 1916, and first appeared in the summer 2023 issue of CentrePiece, and as the CEPR/VoxEU column ‘Local Concentration and Structural Transformation’.
- Please read our comments policy before commenting.
- Note: This article gives the views of the author, and not the position of USAPP – American Politics and Policy, nor the London School of Economics.
- Shortened URL for this post: https://bit.ly/3parsRu