 The number of women winning seats in US House of Representative elections has increased dramatically in recent years. And yet women currently hold only 19 percent of House seats, a figure which has remained relatively constant since 2002. Some argue that unique barriers to entering politics can explain this lack of female representation while others attribute it to a “gender penalty” imposed on female candidates by voters and campaign donors. In an analysis of primaries for House seats between 1982 and 2012, L. Jason Anastasopoulos finds no evidence that voters and campaign contributors engage in overt gender discrimination against female candidates. He argues that that current low levels of female representation are likely to be better explained by unique barriers to entering politics that women face.
Since the 1980s the number of female representatives and the number of female candidates running for office in US House of Representative general elections increased fourfold from 5 percent in 1980 to 20 percent in 2012.
Figure 1 – Proportion of female candidates running in House of Representative general elections, 1980–2012
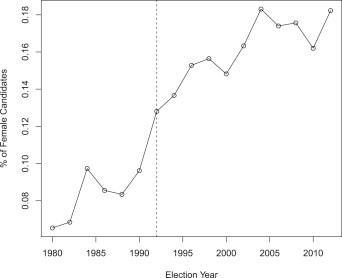
After the number of women holding House seats doubled between 1992 and 2002, many believed that women would reach parity with men shortly after the beginning of the new millennium. What actually occurred, however, was significant decline in the rate at which women were entering, and winning, House races after 2002. As Figure 1 shows, the proportion of female candidates skyrocketed after 1990, but remained relatively constant after 2002 prompting many to wonder why the growth of female politicians in the House had effectively stopped.
Research on the role that gender bias plays in limiting the number of female representatives is mixed. Some find that even though gender stereotypes exist among potential voters, they do not hurt female candidates. Most observational studies which estimate the effects of gender on election outcomes find that female candidates tend to raise as much money and win general elections as often as males while others have found that after controlling for candidate “quality”, women do significantly worse than men, on average.
Research on gender discrimination by campaign contributors is also mixed. Some find that women tend to raise less money than men on average while others find that women tend to be better at raising campaign contributions than men, but they also have to work significantly harder per dollar earned to secure these contributions.
These contradictory findings demonstrate some of the hazards that omitted variables bias can pose. Sarah Fulton makes this point particularly clear because without the control for candidate “quality” she finds no female electoral disadvantage, but with it, a significant disadvantage emerges.
Of course, even if we were able to control for all of the observed differences between male and female candidates, there may be unobserved and/or unmeasured differences between male and female candidates that are correlated relevant outcomes such as election returns and campaign contributions which could affect causal estimates.
Is there causal evidence of gender discrimination against female candidates?
To correct for this and assess whether voters or campaign contributors levy a “gender penalty” against female candidates, I use a causal inference technique known as a regression discontinuity design. This technique is based on the intuitive idea that when a cutoff value determines whether a group receives a treatment, people who are barely above and barely below that cutoff value receive that treatment by chance. For example, if a scholarship required a minimum SAT score of 1300, students scoring slightly above a 1300 receive the scholarship while those scoring slightly below 1300 do not. For this group of students, we can claim that they received the scholarship by chance, even though their academic abilities are similar. The way that the treatment is allocated allows us to better estimate the causal effects of a treatment on a relevant outcome.
In the case of male and female candidates in US House of Representative elections, the institutional selection mechanism which determines whether a male or female candidate will run in the general election are the primaries. And, as it turns out, within a special subset of primaries, two candidate, partisan House primaries in which a male-candidate barely wins against a female candidate and vice-versa, a male or a female Republican or Democratic candidate will be nominated by their party to run in the general election by chance.
Figure 2 – Regression discontinuity design setup
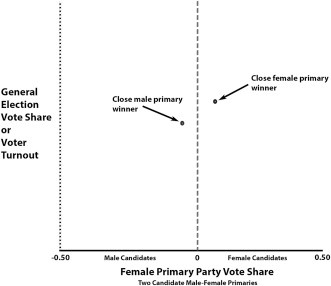
This is illustrated in Figure 2 above. For our purposes, the “treatment” is whether a male or a female candidate will be nominated by their party to run in the general election and the “scores” are the female House primary vote margin (simply the vote share of the female candidate minus the vote share of the male candidate) within parties. Thus, for example, if a female Republican candidate barely lost to a male Republican candidate in the primaries, that female candidate was nominated to run in the general election by chance and vice versa.
With this framework, we are then able to isolate the causal effect of gender on various general election outcomes. Because we are interested in whether voters or campaign donors discriminate against female candidates, we explore the effects of candidate gender on three primary outcomes: general election vote share, individual contributions and PAC contributions. If female candidates that are electorally similar to male candidates receive fewer proportional votes in the general election, this would provide strong evidence in favor of voter gender bias against female candidates.
Figure 3 – General election vote share for male v. female winners of close primaries with 1 percent bins

Note: Dotted lines are 95 percent confidence bands.
Figure 3 presents average general election vote share results for male (left of dotted vertical line) and female candidates (right of dotted vertical line). If voters tended to discriminate against female candidates of similar quality to male candidates, we would expect to see that the beginning of the line on the right hand side of the plot would fall well below the end of the line on the left hand side of the plot. Instead we see no gap, suggesting that male and female candidates nominated by chance receive a roughly equal general election vote share.
We find similar patterns when comparing contributions from individuals and political action committees (PACs), shown in Figures 4 and 5 below.
Figure 4 – Log total individual contributions for male and female winners of close primaries, 1 percent bins.
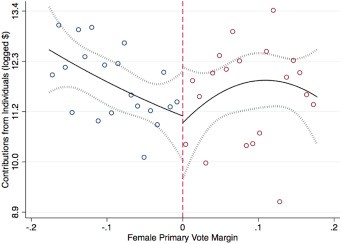
Note: Dotted lines are 95 percent confidence bands.
Figure 5 – Log Total PAC contributions for male and female winners of close primaries, 1 percent bins
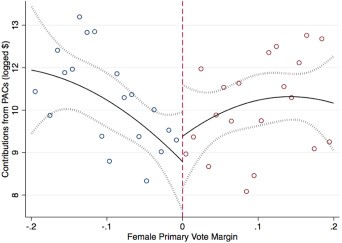
Note: Dotted lines are 95 percent confidence bands.
Taken together, these results suggest that similar male and female political candidates do not appear to face a gender penalty from voters, individual campaign contributors or PAC contributors.
The fact remains, however, that women occupy only 19 percent of the seats in the House of Representatives and this trend does not appear to be improving over time. These results and other data suggest that this may be due to unique barriers to entering politics that women face which should be explored in greater detail. In 2016, for example, out of the 2,421 House candidates that filed with the Federal Election Commission, only 272 or 11.2 percent of those candidates running were women.
This article is based on the paper, ‘Estimating the gender penalty in House of Representative elections using a regression discontinuity design’ in Electoral Studies.
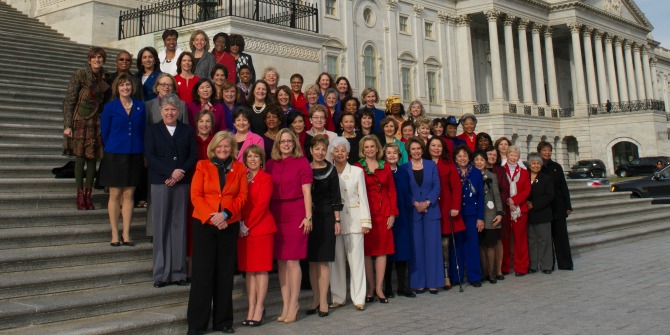
Featured image credit: Nancy Pelosi (Flickr, CC-BY-2.0)
Please read our comments policy before commenting.
Note: This article gives the views of the author, and not the position of USAPP– American Politics and Policy, nor of the London School of Economics.
Shortened URL for this post: http://bit.ly/2h9ItqN
_________________________________
About the author
L. Jason Anastasopoulos – University of Georgia
L.Jason Anastasopoulos is Assistant Professor in the departments of Public Administration and Policy and Political Science at the University of Georgia. His research interests include understanding how business interests affect policymaking processes at the state and federal levels of government in the US, understanding the roots of collective and religious violence internationally and how gender and race influence political processes among political actors in the US.