 Is obesity is a determinant of voting behaviour? Peter Ormosi notices that in the UK areas with high obesity levels were much more likely to vote Leave even when controlling for other important variables. He maintains that while it would be naive to think that body-weight determines voting preferences, body-weight and life-style choices are however things that could help us better understand the psychology of voters.
I saw a presentation today that had an obesity map of the UK on one of its slides. Someone made a flippant comment about how much the map resembled to map of EU referendum results, and indeed it appear that more obese areas were more likely to vote Leave. This of course got me to spend a little time looking at the referendum results and local area statistics. The findings are interesting. Areas with high obesity levels were much more likely to vote Leave even when controlling for income, health, education, economic activity.
I’m sure thousands of people will now dedicate a lot of their time trying to find out more about the why and the how of the EU referendum. I have no intention of taking the fun away from them, all I do here is present some patterns of a briskly compiled dataset. The first thing I wanted to look at was whether there was correlation between obesity and the EU referendum vote. Luckily, data is available on the % of people voting on Leave/Remain in each English local area (England has 326 districts – I focused only on England because obesity data was most readily available for English districts), and Public Health England provides the obesity data.
Here are the top 10 districts with the highest and lowest percentages of Leave votes and the corresponding percentages of obese people (BMI 30kg/m2 or over). The percentage of obese people in each district varies between 13 and 35%. It does indeed appear that high proportions of Leave votes are associated with high proportions of obese adults.
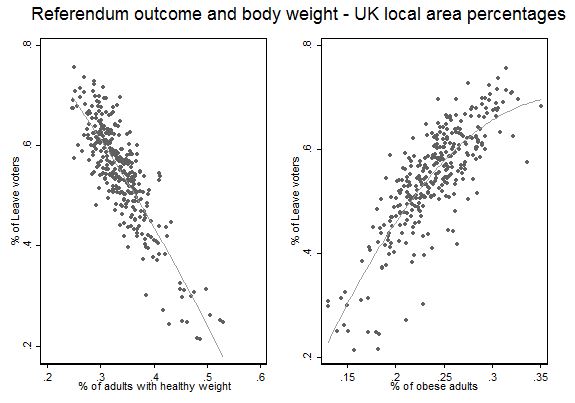
Looking at all 326 districts the correlation between the % of obese adults in a district and the % of Leave votes is high, with a correlation coefficient of 0.8 (0 implying no correlation and 1 perfect correlation). Scatter plots below confirm this. On the left hand side you can see how the percentage of Leave voters decreases with the percentage of adults with healthy weight. The right hand side plots shows that the percentage of Leave voters increases with the percentage of obese adults.
OK, so the knee-jerk reaction will be: yes, but this is all driven by other factors. For example poorer areas tend to have more obese people and poorer areas were more likely to vote Leave and so on. So I quickly downloaded district level census data on some of the most obvious factors that might be affecting both the referendum vote and the % of obese adults. The factors I looked at were: income, the variation of income (my crude measure of inequality), the level of health of adults, the level of education of adults, and the economic activity of adults.
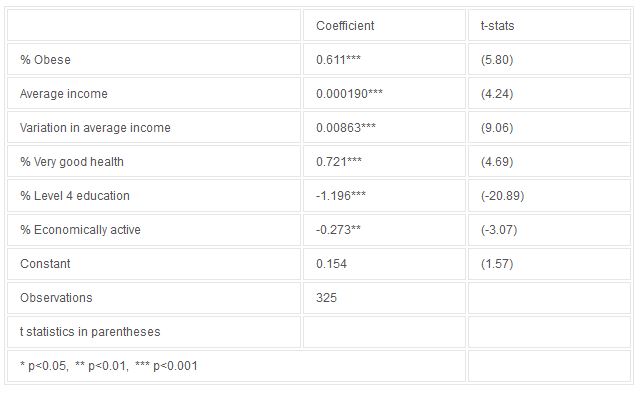
The table below shows that obesity is still a strong determinant of Leave votes. A 10 percent increase in the number of obese people leads to a 6 percent increase in the number of Leave vote. More adults with higher education and being economically active has a negative effect on the proportion of Leave votes.
So what’s going on here? My immediate thought was that obese people have poorer health and are probably more likely to worry about NHS access, which was one of the flagship Leave campaign arguments. But the results below reveal the opposite effect – areas with more healthy people have a larger % of Leave votes. Very peculiar.

It is unlikely that being overweight itself affect people’s voting preferences. Instead this is probably driven by personality traits that characterise both Leave voters and obese adults. A Swiss study on obesity and personality traits reveals 5 important personality traits that affect eating disorders. Extrovert, open, conscientious, and agreeable people are less likely to have eating disorders, and neurotic people are more likely to have such disorders.
So can we jump to the conclusion that Leave voters are less likely to be extrovert, open, conscientious, or agreeable, and more likely to be neurotic? This work argues that personality traits are indeed important drivers of voters’ preference. This other post makes similar claims but at country level (credit to Chris Hanretty for the tip).
It would be naive to think that body-weight determines voting preferences. But body-weight and life-style choices are things that we can easily measure. If we know the sort of personality traits these physical characteristics imply, it could help us understand the psychology of voters much better. Certainly worth further exploring.
Data downloaded from the Office of National Statistics, Nomis (official labour market statistics), Public Health England, and the Electoral Committee.
Caveat 1: age was one of the main determinant of the referendum vote so it might appear to be an obvious omitted variable. However age doesn’t seem correlated with obesity so it’s unlikely to be biasing the obesity coefficient. Here I included a table where the other variables (except income) are further classified into various age groups. One thing that stands out is that health status, qualifications, and economic activity does not make any difference for the youngest and the oldest age groups. It appears preferences are set for these two age groups and demographic characteristics do not alter these preferences (i.e. the young tend to vote Remain and the elderly tend to vote Leave irrespective of their health status, qualifications, and economic activity).
Caveat 2: Of course one could control for a catalogue of other things from census data but as I highlighted before, this is not a full-fledged analysis, rather some food for thought. The same applies for the choice of model specification, etc.
This article first appeared here and ot gives the views of the author, and not the position of BrexitVote, nor of the London School of Economics.
Peter Ormosi is Senior Lecturer (Associate Professor) of competition economics at the Norwich Business School and a member of the ESRC Centre for Competition Policy at the University of East Anglia.


What about controlling for ethnic composition? The areas of highest obesity look predominantly white while the lowest have large Asian populations. Asians are less prone to obesity and more likely to vote remain.
I’m pretty sure you can download data on personality traits from the British Household Panel Survey. Might be worth a go?
Bloody good job, Brits. You would rather stand in bread lines than take in immigrants.
Bunch of bloody idiots.
Thanks for the analysis. I came across the obesity stats and also thought they looked remarkably close to the Leave distribution, I was going to investigate but you’ve already done it…
I’m not sure you can read too much into the census health stats. These are self-reported, how many obese people would report themselves as not being in sound health? Not clear what you’re implying about personality traits either. It seems unlikely that people possess certain characteristics that mean (a) they put on weight, (b) they don’t like the EU, and (c) that these people congregate in same places.
I’m sure the simple explanation you suggested is the root cause, that (relative) poverty was a strong driver in rejecting the EU, and in developed nations this is also a strong driver of obesity.