 Remainers seeking to maximise the impact of their vote in the European Parliament election face a difficult choice. Heinz Brandenburg (University of Strathclyde) explains why district magnitude is such a key factor in the d’Hondt system, and why it means that different regions call for different voting strategies.
The European Parliament (EP) Elections in the UK on 23 May will be different from any previous ones, and not just because they were not supposed to take place at all. In contrast to previous EP elections, these are actually generating interest – because of Brexit, the Brexit Party, the multitude of “Remain” parties, the expected punishment for both the governing and the main opposition party, and plenty of other sub-plots.

What they are also generating is a sudden interest in how EP elections are actually conducted in the UK, and how votes are translated into seats. This is primarily because three Remain parties are contesting these elections separately and competing with each other (Liberal Democrats, Greens, Change UK/The Independent Group). While the Brexit Party appears to be attracting most of the hard Brexit vote, the pro-Remain vote – which is probably equally big – could be split three ways, or even four, given that some Remainers may stick with Labour despite their equivocation around a second referendum question.
So far, at best, people may have been aware that in EP elections a proportional system is used, and not the first-past-the-post (FPTP) system as in general elections. Only now are the British media, the affected parties and voters slowly waking up to the fact that there are variations in the proportionality of PR systems, and that the one used in the UK is not overly proportional. This creates problems for parties to convert votes into seats.
Because of this, we suddenly hear the name d’Hondt bandied about in the British media. D’Hondt is one of the available methods of allocating seats in multi-member districts, and is the method in use for the European elections in the eleven electoral regions of Great Britain (not in Northern Ireland, where the Single Transferable Vote is used). Table 1 illustrates how d’Hondt works, with the example of South West England, a six-seater electoral region in the 2014 EP election: each party’s total votes are listed in the first row, while the further rows display votes divided by two, three, four and so on. After identifying the six highest numbers in the spreadsheet, each gets a seat allocated. Note from the example that the Liberal Democrats, even though their vote share was not far off the Greens, would not have won a seat if seven had been on offer, as UKIP would have edged them to win their third seat.
| Votes | Votes/2 | Votes/3 | Votes/4 | Votes/5 | Votes/6 | |
|---|---|---|---|---|---|---|
| UKIP | 484,184 | 242,092 | 161,395 | 121,046 | 96,837 | 80,697 |
| Conservative | 433,151 | 216,576 | 144,384 | 108,288 | 86,630 | 72,192 |
| Labour | 206,124 | 103,062 | 68,708 | 51,531 | 41,225 | 34,354 |
| Green | 166,447 | 83,224 | 55,482 | 41,612 | 33,289 | 27,741 |
| Liberal Democrat | 160,376 | 80,188 | 53,459 | 40,094 | 32,075 | 26,729 |
But d’Hondt is not really what creates disproportionality – that is instead brought about by relatively small district magnitudes. The term district magnitude describes the number of seats in an electoral district. In FPTP, district magnitude is 1 and results are least proportional. The eleven EP election regions in Great Britain allocate between three and 10 seats, which means district magnitude ranges between 3 and 10. And that is where things become disproportional. If Britain used the same system as, for example, Germany, with no subdivision into regions, just allocating its 70 seats according to national vote shares, the d’Hondt system would create an almost perfectly proportional outcome.
And the important point is that EP elections in the Britain not only use a somewhat disproportional system, but that the system is differently disproportional across British regions.
With decreasing district magnitude, electoral thresholds emerge – i.e. parties need to win an increasing share of votes in order to convert these into at least one seat. Figure 1 reports how over the past four EP elections, since PR was introduced in 1999, required vote shares vary across electoral regions, depending on the number of seats on offer. Competing in North East England (three seats), a party typically needs to win over 15% of the votes to convert into one seat and over 30% to win two seats. Whereas in South East England (ten seats), 8% tends to be easily enough to win a seat, 15% sufficient to win two.

Note: Data points show the lowest vote share ever recorded for a party winning one (black dots) or two seats (blue dots) across EP elections 1999-2014, and the highest ever vote share recorded for a party that failed to win a seat (red dots) or failed to win more than one seat (pink dots). The added yellow line shows the effective threshold by district magnitude as proposed by Arend Lijphart (eff thresh = 75% [m+1]), illustrating the fit with empirical data from EP elections in the UK.
This means that parties face vastly different competitive situations across electoral regions, and also voters face different situations – lower district magnitude would require more tactical voting in order to make votes count. However, given the low salience of EP elections and knowledge about them, British voters have shown no signs of adapting to the varying electoral contexts. This is illustrated in Figure 2 which reports how fragmented election results were across regions with varying district magnitude. It uses the measure of “effective number of electoral parties” which helps to measure fragmentation of the party system. Basically, if half of the voters vote for party A and the other half for party B, we have a perfect two-party system (ENEP=2), whereas if five different parties receive the votes of a fifth of the electorate each, we would have a perfect five-party system (ENEP=5). Figure 2 shows that fragmentation varies systematically between EP elections but does not respond to changing district magnitude.
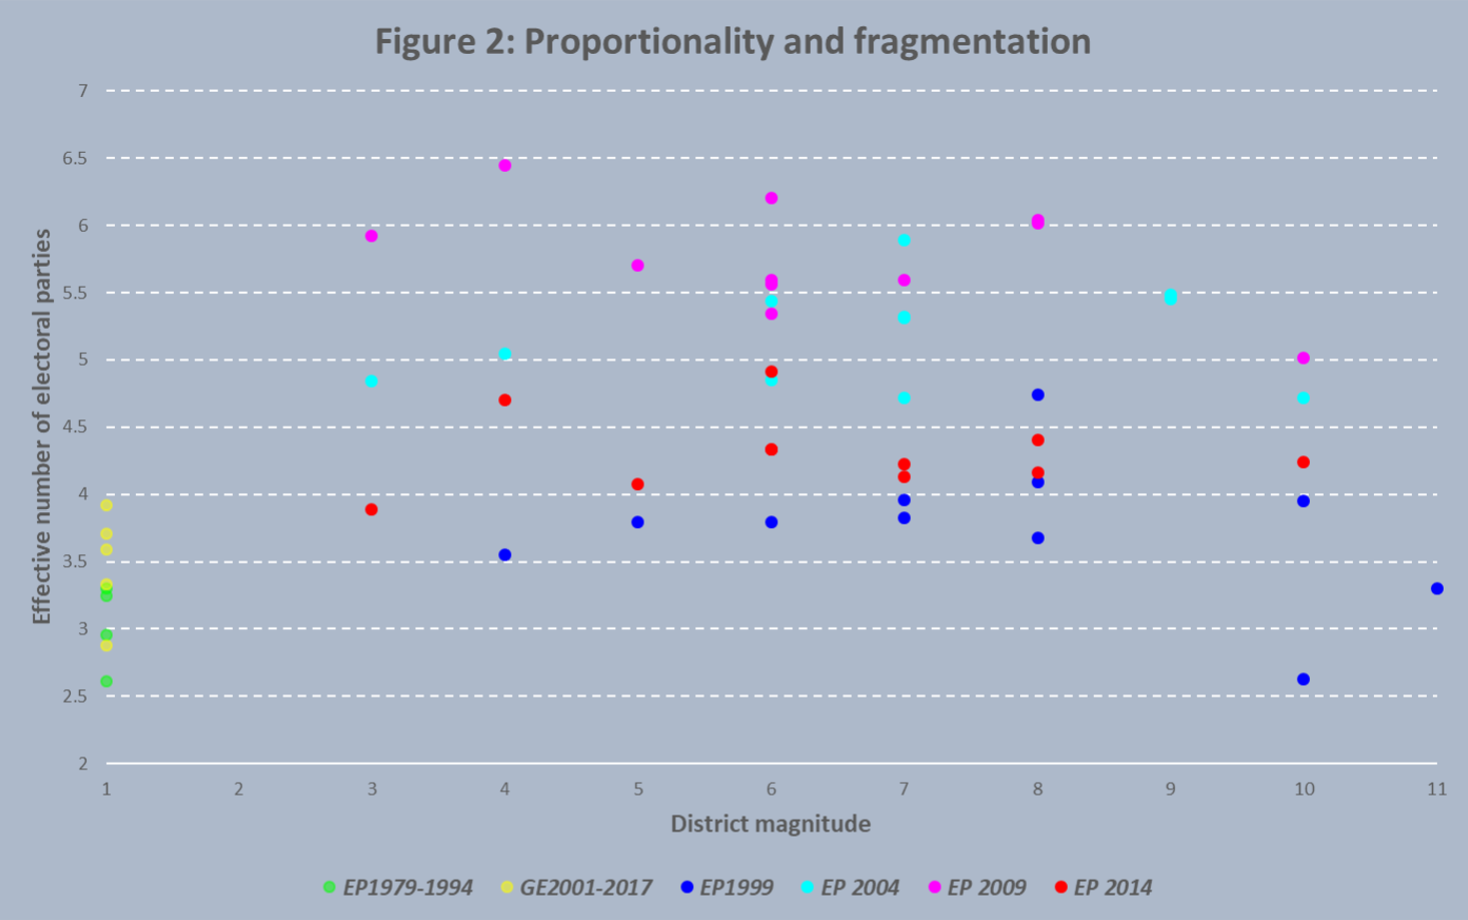
For comparison, I added ENEP scores for the EP elections before 1999 when FPTP was still used, as well as for general elections after 1999 – on the left side, at district magnitude of 1. (These are obviously not directly comparable, as ENEP in earlier EP and later general elections are measured for the entire country, whereas those for EP 1999-2014 at the level of electoral regions. These are only meant for general comparison of how voting varies between FPTP and PR elections.) Here we do see that voters behave differently under PR than under in FPTP – more votes go to smaller parties. But voters in EP elections behave as if elections were equally PR across all regions – voters in NE England or Wales are just as likely to choose from a wide range of parties as those in London or SE England, despite small parties having a much lower chance of gaining seats.
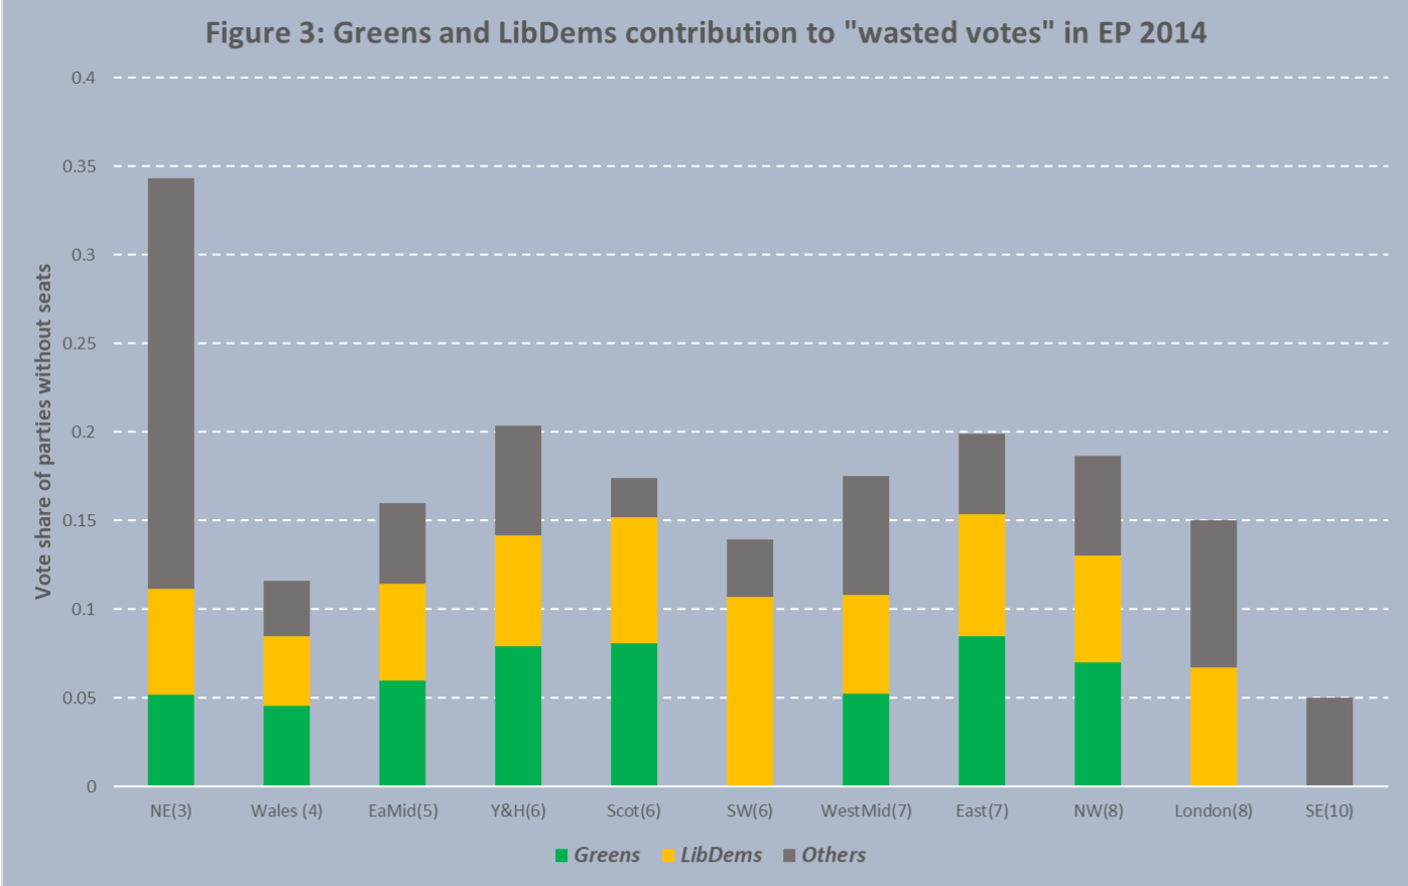
What happened in 2014 gives us some idea of the challenge faced by pro-Remain parties and voters in the upcoming EP elections: two of the three now competing pro-Remain parties, the Liberal Democrats and the Greens, suffered badly in 2014 from voters behaving almost identically across very different electoral contexts. Between them, the two parties won over 2.2m votes (13.4%) but only four seats (5.5%). Three of their four seats were won in London and South East England where both parties polled close to their national average. The only exceptional performance came in SW England, where both achieved over 10% – enough for the Greens to win a seat but not the Liberal Democrats.
In total, two thirds of their 2.2m votes were “wasted”, in the sense of being cast in regions where no seats were won. In total, Liberal Democrats and Greens contributed 1.5m or 62% of all “wasted votes” across Britain (see Figure 3). However, only in the three regions with the smallest district magnitude (NE England, Wales and East Midlands) was their combined vote share below the effective threshold.
For the current contest, a recent FT analysis of regional breakdowns projects the three English pro-remain parties to convert their combined 27% or so into only nine seats (12.8%), while the Brexit party is looking at converting just under 30% of votes into 29 seats (41.4%). The latter is doing so well because it polls at well over 30% everywhere outside Scotland, Wales and London and hence is on course to win multiple seats in all of those regions.
In the absence of any pact or coordination between pro-Remain parties, pro-Remain voters are facing a tricky task when looking for ways to vote tactically in order to maximise the seat share of pro-Remain parties. Importantly, they would be ill-advised to apply identical tactics across the board.
The general urge among pro-Remain voters is probably to agree on one of the pro-Remain parties at the expense of the two others, but however hard they may try, without party agreements and more central coordination this will remain quite haphazard. While an actual electoral pact might have maximised returns, some half-hearted concentration of votes in favour of one party would create sub-optimal outcomes in regions with low as well as in regions with high district magnitude.
It will fail in NE England or Wales because any such haphazard effort to vote tactically will not be sufficient to get that one party over the required threshold of 15% or more. It could be most successful across regions with district magnitude of 5-7, if it helps getting at least one party over the threshold of 10-12%. However, in London, NW England or SE England (with eight or more seats), it could actually reduce the overall number of seats the three pro-Remain parties could win between them. If, for example, tactical voting pushes one pro-Remain party close to 15% but reduces the two others to 5 or 6%, the bigger party will not have enough to win multiple seats (look again at Figure 1 and the threshold for winning more than one seat) while the others could both fail to win a single seat. That could reduce the pro-Remain parties to a single seat where three could have been won.
Where the effective threshold is well below 10% (London, SE England, NW England), the best outcome for pro-Remain parties would actually be for the vote to be as evenly split between them as possible.
This post represents the views of the authors and not those of the Brexit blog, nor the LSE.
Heinz Brandenburg is a Senior Lecturer in Politics at the University of Strathclyde.


Seems to be a case of the old “Divide and Rule”, which enabled a small country like the UK to rule a vast country like India, at work again. If the anti-Conservative forces in Britain can’t get their act together, they are doomed to be dominated by numerically smaller Conservative forces.
This has always been the case when Tory governments get into power with around 35% of the vote in General Elections. The crafty Tories hiding behind the Brexit Party are now going to pull the same trick in the forthcoming European Elections.
I have just come across this interesting new site from Gina Miller which provides an interesting take on this problem.
Her take is that throughout England ardent remainers should vote Liberal Democrat, in Scotland they should vote SNP, and in Wales vote Plaid Cymru. Labour would become attractive if they hardened their current equivocal stance.
The site is called Remain United and is linked to here: http://www.remainunited.org .
Hi Friedrich,
Thanks, indeed an interesting analysis. The second table on https://www.remainunited.org/be-tactical/ which assumes 50% of Remainers vote tactically for Remain, predicts, from 70 UK MEPs altogether, 16 from what are called Remain parties, 32 from Lab + Con and the other 22 from the Brexit party. That doesn’t look good for the Remain parties. I think if I were entitled to vote in the UK and my top priority was remaining within the EU, I would be trying to put as much pressure as possible on the Labour Party to get them to back a second referendum, since sending a message with 16 out of 70 MEPs seems fairly hopeless, and there is undoubtably a large section of the Labour Party which would like to remain.
Most of the regions are predicted to elect only one or two Labour MEPs. If you live in one of those regions, wouldn’t it make sense to find out what your local Labour candidates plan to do if elected, rather than writing them off on the basis of the Labour leadership’s lack of support for a second referendum?
For Brexiteers the conclusion from the table would seem to be: vote Brexit or Con (I think one can assume Con is less Brexitty than Lab) with the decision made based on a. how close the race is in your local area, b. if you want a hard Brexit or May’s deal, c. again, the local candidates.
Sorry, stupid typo “I think one can assume Con is more Brexitty than Lab” is what I should have said, of course.
It is pathetic to hear Remainers whinging about the EU election system when in the 2015 General Election UKIP received 12.5% of the vote but only 0.2% of the seats.
Rubbish – as much as I dislike UKIP that election demonstrated how unsuitable FPTP is for anything, and I’d have much rather have seen those people represented fairly, even against my own interests. I find so many people are unable to see what is right and fair when it doesn’t happen to align with what they wanted. And before you point to the referendum result and “respecting democracy” – that’s the point, it wasn’t fair!
I know, but somehow that just felt right when it’s concerning a party that was and is a disgusting stain on the UK.
Politics is really about priorities. Once again, the Remainers are probably going to lose because, to them, being in the EU is not THAT important. Not important enough to allow them to forget their differences on other issues and put up common candidates. Just like in 2016.
In some ways the plethora of minor pro-Remain parties getting in each other’s way is rather funny. All that’s missing is for the Tooting Popular Front to demand a People’s Vote and put up Wolfie Smith as a candidate.
Being in the EU isn’t really that important compared to sorting out domestic issues like regional inequality, child poverty, knife crime, etc. All of which have very little to do with the EU. Why should the UK care about the EU issue more than setting its own house in order first and foremost? The worst years of austerity wouldn’t have been forestalled or mitigated by EU membership anyway.
Also, Europhiles in the UK should probably put their money where their mouth is and campaign for the UK to reenter the EU on fresh equal terms as every other EU state. Meaning the acceptance of Schengen and the Euro amongst other things. Funny how none of the British Europhiles are up for that, instead they talk about Remaining in the EU only with all the current exceptions the UK enjoys from the regional organisation and political bloc. Wanting cake and getting to eat it too? That’s Remainers in a nutshell.
Much of the post is about Great Britain.
I’m in N Ireland; we use the STV system for the three MEPs. We are well used to STV here, in both local council and the Assembly elections.
It’s not yet clear which parties, if any, outside the local ones will be participating.The LibDems don’t run here, their ‘partners’ are Alliance; Labour doesn’t run here, their partner is the SDLP. The Conservatives have a tiny base, as do UKIP. ChangeUK and the Brexit party may not even be established here.
The ‘unionist’ parties are all Leave. Alliance, SDLP, the Greens, and SF are Remain. The ‘English’ parties can probably be discounted.
Depending on your particular shade of green, Remain is probably best served with Alliance first, then the SDLP, then the Greens, then SF.
Yes, I only looked at GB and not NI, because the focus was on the variation in proportionality across England, Scotland Wales who use the same electoral system.
For NI, two seats seem to be certain, one each for DUP and SF. Previously, UUP would take the third, but loyalist vote is not as strong anymore, so SDLP and Alliance may both be in the running for that seat.
I probably agree with your suggestion of top three preferences Alliance, SDLP, Greens. Greens are weak, but the other two are in the running. Either could beat UUP for the third seat.
As a pro-remain voter I am completely clueless how to make my vote count. Any advice for East Midlanders?!
Some uncertainty in East Midlands. Probably only one seat in play for pro-Remain parties. At the moment looks like LibDems are most likely to get a seat.
In NE England would you say that Labour is the party most likely to get over 15% of the vote (as opposed to the Brexit party)? Would like to vote for an unambiguously pro-remain party, but my main priority is to vote for the party most likely to win a seat over the Brexit party
The issue is really to prevent Brexit party from winning two of the three seats on NE. Early indication seemed that Lab and Brexit party were almost level, but I would suspect that in line with national polls, Brexit party is moving ahead with Labour losing ground. There may now be a case for voting LibDems, as they may have a shot at getting over 15% together with Labour, so each of them could win a seat.
But I am strongly suspecting that it will end with two seats for Brexit party and one for Labour.
Any advice for remainers in Yorkshire and Humberside please?
We haven’t had a proper poll from Yorkshire/Humber that would clarify who among LibDem or Greens are most likely to win a seat. Both would be a surprise. Greens were ahead of LibDems in 2014 but both fell short.
Any suggestions for pro-remainers in the West Midlands?