 Thiemo Fetzer (University of Warwick) addresses the misunderstandings and the criticisms of his widely-read 2018 paper “Did Austerity Cause Brexit?”. In August 2018 the Guardian Politics liveblog featured the headline: “Brexit is direct result of austerity and cuts like bedroom tax, research suggests.” The blog contained a set of graphs and paragraphs from his paper, which has since been accepted for publication in the American Economic Review.
1. Was there austerity?
One of the first critiques I received from James Ferguson, founding partner of Macrostrategy UK LLP (who regularly appears on the BBC, Sky TV, Channel 4 and Bloomberg TV), was the assertion that actually there had been no austerity at all. This was sent via an email, along with a request to retract the paper and “in expectation of no serious reply.” I, of course, replied helping James make sense of the data.
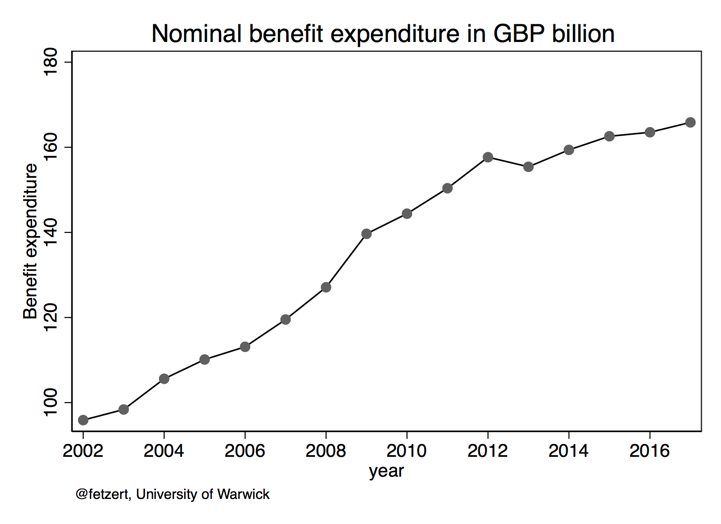
Behind James’ original assertion, which has since been repeated quite regularly in social media and elsewhere, is the above figure plotting out data on nominal benefit spending over time. This has steadily trended up over time suggesting that indeed, there was little austerity apart from a slightly weaker trend growth post-2010. So what is misleading about this figure? Firstly, the obvious: the figure is inflated by plotting nominal figures not adjusted for inflation nor accounting for population. But what’s even more important is that it masks a dramatic compositional shift that only becomes visible when decomposing benefit spending. The below plot attempts to do that along a single dimension: decomposing social benefit spending targeted at pensioners vis-à-vis the rest of the population (mainly benefits for working-age adults). As becomes evident, even nominally and not adjusted for population, benefit spending directed to pensioners has dramatically increased since 2010.
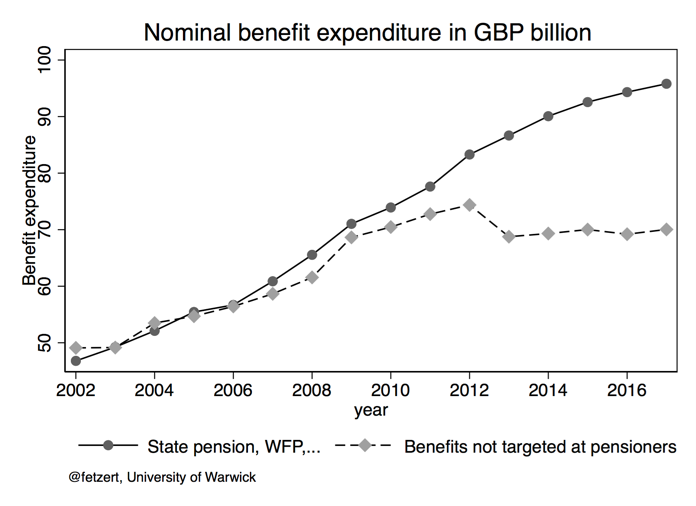
At the same time, spending on benefits not targeted towards pensioners, like ESA/DLA/ housing benefit, JSA/council tax benefit, etc. have flatlined and even declined in nominal terms relative to 2012. The primary reason for the divergence is due to the triple lock essentially guaranteeing that state pension spending outpaces productivity growth and other benefit spending, which, in turn, has seen austerity by stealth by imposing nominal freezes for the bulk of benefits. When accounting for inflation, which over the period from 2010 to 2018 easily amounts to 25%, this flat nominal spending turns into real declines. Yet, this still understates the true extent of austerity, as low-income household’s exposure to inflation is different, as the composition of their consumption basket differs from the average.
The answer is quite evident: there was austerity. The design of austerity was a political choice and the fact that this was disputed by professional economists is astonishing. The 2010 Conservative-led government chose to implement a type of austerity that reshuffled spending away from the future and current generations by cutting spending on education (crumbling schools, tuition fees) and the working poor (tax credits and housing benefit cuts), to state pension recipients. This, of course, is not to suggest that state pension recipients have been sheltered from austerity. In fact, the UK’s state pension is among the lowest in developed countries with old age poverty sharply on the rise.
2. If pensioners were mostly spared from cuts, isn’t there something flawed about the analysis, as older people were more likely to support Leave?
It is important to distinguish the Leave voter who, all else equal, would have voted Leave well before 2016 vis-à-vis those that came around to supporting Leave over time and, in particular, since 2010. These are two distinct social groups. Looking, for example, at the Eurobarometer studies we see that among all survey participants between 2000 and 2010, quite persistently 44% of respondents aged above 60 at the time of the survey think that the UK’s EU membership is bad for the UK – this compares with just 25% respondents aged younger than 60. The older population demographics have been persistently more Eurosceptic. It is this generational difference that comes out sharply in any descriptive analysis of the 2016 EU referendum, one of which I have written myself. Yet, it is important to highlight that the EU referendum was not tipped in favour of Leave due to the above minority group of life-long Eurosceptics. The referendum was won because Leave swayed a non-negligible share of working-age adults into backing it. Many of these groups have been directly and indirectly affected by austerity. If I were to put a figure on the size of the groups, I would estimate that around 35 percentage points of the 52 percentage point Leave support is due to life-long Brexiteers. Out of the rest (17 percentage points), I estimate that between 6-11 percentage points of the Leave vote were due to austerity-induced protest voting.
3. Leave voters actually supported austerity
The third critique that appears to have made quite a splash in social media is the assertion that UKIP or Leave supporters were actually supportive of austerity. This was recently implied in a provocative social media post by the renowned Professor Robert Ford at the University of Manchester.
The idea that austerity fuelled UKIP and Brexit has become popular. Here's a chart from "Brexitland" my book-in-progress with @smthgsmthg which is hard to square with that: UKIP did best in 2014 European Parl elex with voters who thought austerity cuts *did not go far enough* pic.twitter.com/gWcL9JtsTZ
— Rob Ford (@robfordmancs) June 21, 2019
This tweet was shared around 300 times and likely was seen by tens of thousands. It suggests that UKIP did best in the 2014 European Parliamentary election among voters who thought austerity cuts “did not go far enough.” This, coming from a renowned academic, may carry quite a bit of weight in the public debate. Robert argues that “if austerity cuts drove anger among voters which then drove UKIP (and Brexit) support we would expect the *opposite* relationship – UKIP doing best among those most opposed to cuts. Instead, Farage et al were rallying people who wanted the axe to fall HARDER.”
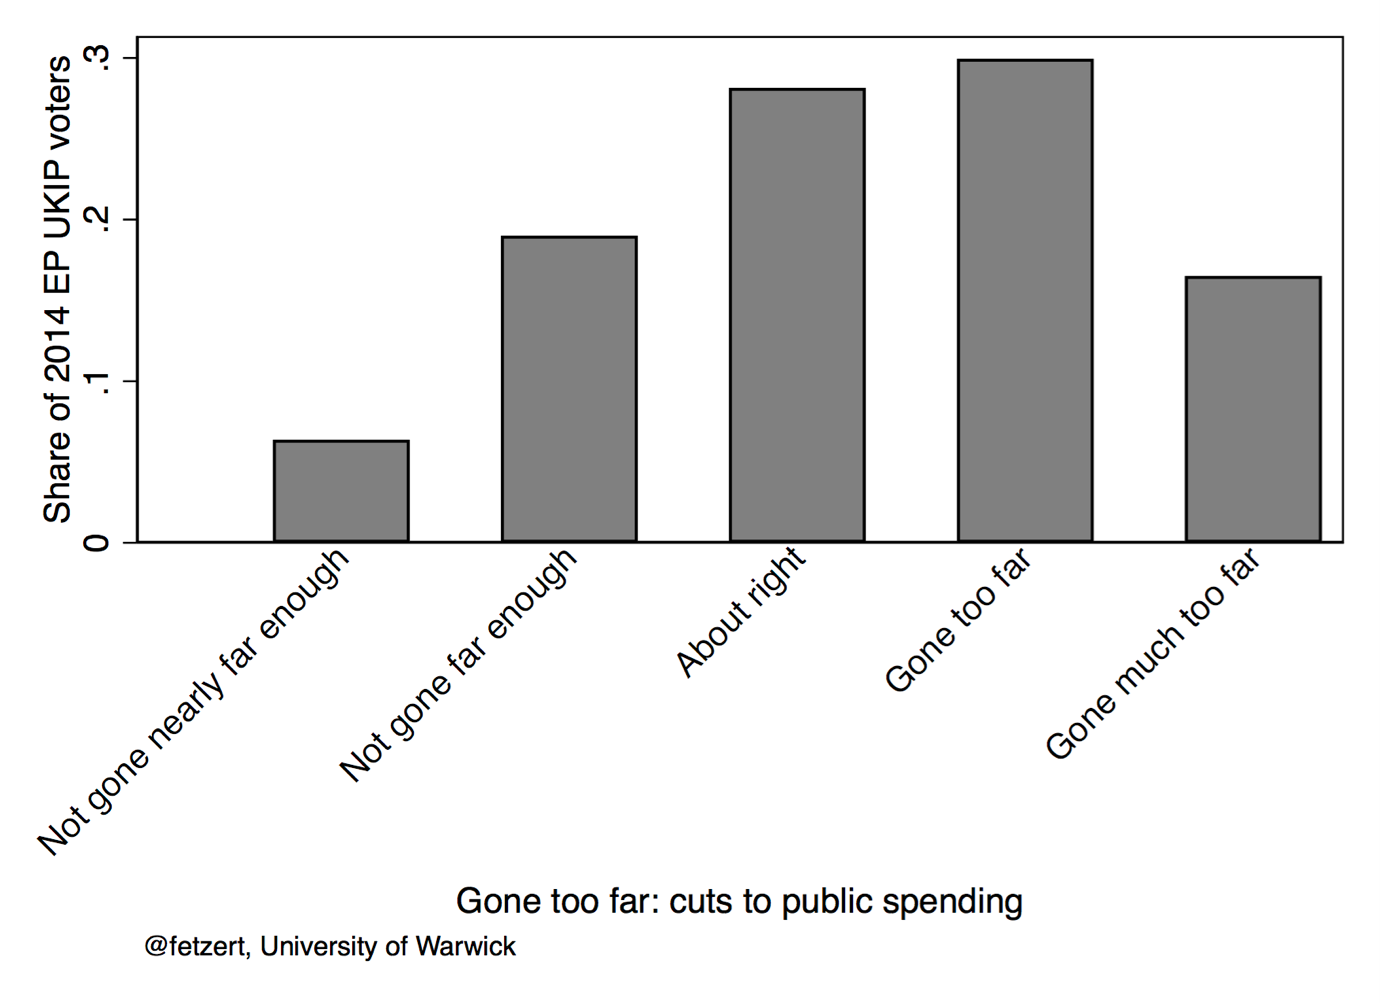
So, what is problematic about this analysis? The regression analysis in the plot compares the lack of support for austerity among UKIP voters to those that did not vote for UKIP. I took a look at the exact same data to arrive at a more nuanced picture. First, it is instructive is to look at the level of support for UKIP in 2014 and preferences for austerity. The figure below suggests that even among UKIP supporters, austerity was hardly popular. Around 50% of UKIP voters state that they perceive that austerity had either “gone too far or much too far.” Only around 6% of UKIP voters stated that austerity should go much further. That means UKIP supporters did not overwhelmingly support austerity, as some may deduce from reading Robert’s figure.
What is the figure in the tweet picking up then? It is capturing the fact that among those that did not vote UKIP, austerity was even more unpopular. Among the non-UKIP voters in 2014, only 1.6% stated that austerity has not gone far enough – the difference of around 4.4% is exactly what is being picked up. The right way to present this is that, while austerity was actually quite unpopular among all UK voters, including UKIP supporters, it was just slightly less unpopular among UKIP voters. This could be due to many factors. One particular one could be that the support base for UKIP is or was quite heterogeneous. A 2014 YouGov poll of around 1600 UKIP voters suggest that at least 26% of the UKIP voters stated they support UKIP as they were “Unhappy with other three parties/send a message/protest vote.” Only 43% stated they supported UKIP because they want “to leave Europe, unhappy with Europe.”
4. Austerity is just one of many factors that matter
The story of Brexit is indeed complex. Unfortunately, even to date, there is little work that comes close to identifying causal relationships. Most of the existing work provides a characterisation of the average Leave voter or the average Leave-voting region. Some of this correlational work has become very influential in shaping public discourse. Regression evidence suggests a tight association between support for Leave and, for example, individuals self-identifying as English. Similar correlations suggest that Leave voters are more likely to prefer capital punishment. As became clear above, such evidence can easily be misread or misinterpreted – and more importantly, they do not explain changes in Leave preferences over time.
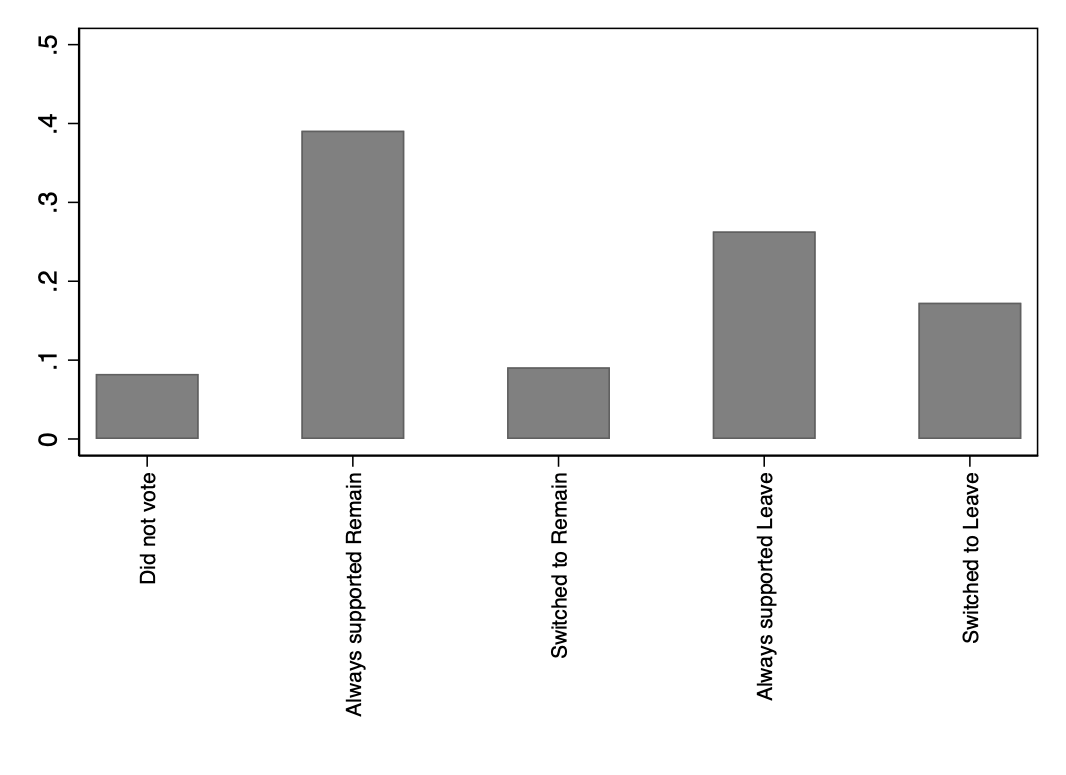
The most important distinction that should be made is between average versus marginal voters. In related work, I show using data from the British Election Study that in the run-up to the EU referendum between 2014 to 2016, support for Leave was bolstered by a sizable share of individuals switching from Remain to supporting Leave. In the BES data, between 33-40% of support for Leave in 2016 is due to individuals changing their EU referendum voting intention response at least once. Support for Remain is much more stable with only around 20% of Remain supporters switching to Remain from an initial position of supporting Leave. This analysis can only be conducted with people who participated at least twice, and there is a separate issue here: repeat BES participants are much more likely to express support for UKIP, Leave and Nigel Farage as I argue in my blog. The regular and much more Leave supporting BES participants, up to wave 13, received much higher sample weights compared to non-repeat BES participants (who are much more pro-Remain), hence potentially skewing the population averages of support for Leave that are usually published as headline findings.
5. Isn’t Brexit a backlash against globalisation? How does austerity relate to Colantone and Stanig (2018)?
Both my paper and Colantone and Stanig (2018) take causal identification seriously in a context, where this is very challenging. Both papers are, in fact, very closely linked. Colantone and Stanig (2018)’s work suggests that the Brexit vote was particularly pronounced in places of the UK that suffered most from the economic structural adjustments that come with the opening to trade to China. How does this relate to austerity? Places hit by austerity are also the same parts of the UK that suffered most from the trade-induced structural transformation, leading to a steady rise in benefit claimants in these parts of the UK. In fact, in one of the many appendices to the paper, I show that indeed, the Colantone and Stanig (2018) import competition measure is associated with a steady rise in benefit claimants over time. Yet, what it also highlights is that since 2010 this trend growth came to a halt as those who were shifted into benefit receipt due to losing their jobs following the “China shock”, had their benefits cuts. The two stories are closely related. Yet, the “China shock” can only most directly explain the loss of employment opportunities attributable to manufacturing sector decline. Austerity, as I study and show, also affected people who have never worked in manufacturing or had never worked due to a life-long disability.
6. Studying UKIP and not Leave support
Two doctoral students of political science from the University of Manchester wrote a critique of the paper circulated on Conversation with the title “Was Brexit really caused by austerity? Here’s why we’re not convinced”. This became “Brexit wasn’t caused by austerity, and here’s the proof” when it was published by the Independent. The critique was twofold: (1) the paper focuses on UKIP support as a proxy, but support for UKIP is not the same as support for Leave, and (2) UKIP changing its politics and strategy after 2010 explains its success, not a structural increase in the demand for UKIP-style populism.
On the first comment, the paper goes to great lengths highlighting that support for UKIP is only a proxy variable. It is the best we have to study the evolution of political preferences over time. Having voted UKIP in 2015 almost certainly guarantees that an individual supported Leave in 2016. And as I flagged above, a non-negligible share of UKIP voters did vote for the party, not because of the appeal of its policies but because of the broader dissatisfaction with the established parties and as a form of voicing protest. And, acknowledging that support for UKIP is only a proxy measure for the broader Leave sentiment that austerity helped to fuel, I study broader measures of dissatisfaction such as the perceptions that “public officials do not care” and that people perceive “that they have a say” or that their vote does not matter. Importantly, I show that these measures significantly increase among individuals after these were affected by specific benefit cuts. This effect goes through even when controlling for time-varying political preferences, highlighting that UKIP is indeed an imperfect proxy. Further, those same proxies of dissatisfaction are strongly correlated with individuals support for Leave directly, again, over and above what can be attributed to the measure of individual political preferences.
The second critique is really quite important and I partially agree that this merits studying. The question is whether changes in party strategy are consequential and it is important to measure these. This is the classic chicken or the egg problem. Was UKIP’s electoral success down to it being more effective in reaching out to already existing potential Leave voters? Or, was it because there was increased demand for UKIP style politics, possibly fuelled by austerity? One way to tackle this question and one that I think merits further work is to study whether UKIP started targeting different seats and parts of the UK by fielding candidates. In the analysis, also refined to the appendix, I do not find evidence suggesting that UKIP started targeting parts of the UK in local elections particularly exposed to austerity that could explain the effect sizes I observe. But since the data is imperfect, I do think it merits further work. But to argue that there has been no demand-side effect, in my opinion, is not very credible.
7. Declining Euroscepticism since 2010
There was also a comment from Noah Carl (who has risen to some level of fame for conducting pseudo-academic clickbait work and now gets funding from anonymous sources). The critique draws on aggregate time-series data from Eurobarometer and other opinion polls to highlight that since 2010, Euroscepticism in aggregate had actually been decreasing in the UK. This is portrayed as prima facie evidence that austerity could not explain why a referendum was held and why Leave won. The Leave vote meant many things to many different people and according to Noah’s analysis, there should have been no referendum, to begin with. But it’s a matter of fact that there was a referendum and that it resulted in a narrow victory for Leave. In my reply to him, where I actually looked at the decomposed Eurobarometer data, you will see that the data masks substantial heterogeneity and diverging trends among different social and economic strata in society, each of which have different propensities to engage with the political process. The takeaway from this is that one should be very careful when using aggregate data to draw such substantive conclusions.
8. An EU referendum was long in the making and austerity only played a minor role
One of the more tacit points I make in the paper is that, most likely, without austerity, there would have not even been an EU referendum to begin with. This point of the paper often gets misunderstood. I show in the paper, austerity affected electoral dynamics already well before 2016 with the emergence of UKIP in the most austerity hit parts of the UK attracting significant numbers of disaffected voters.
The fact that UKIP attracted a non-negligible share of disaffected voters from the Liberal Democrats in 2015 had dramatic implications. This can be quite well traced in the data. In a sequence of tweets from February 2019 dubbed as a “short history of Brexit” I draw on new primary analysis using BES data that was not included in my original paper to make the point more sharply. What the analysis highlights is that those who voted Liberal Democrat in 2010 were much more likely to swing to UKIP in 2015. This effect is much stronger if they live in a part of the UK that was more exposed to austerity. Austerity also induced the Conservatives losing voters to UKIP, but in relative terms, it hurt the Liberal Democrats much more. As a result, the LD lost seats to the Conservatives in Tory/LD marginals and to Labour in Labour/LD marginals and to the SNP in Scotland. The result was an austerity-induced annihilation of the Liberal Democrats across the UK.
The implications were dramatic. David Cameron and most pollsters predicted that the 2015 election would produce another coalition government. Hence, David Cameron thought he would never have to deliver on the promise of an EU referendum. Yet, the austerity-induced voter shifts to UKIP however, contributed to the outright election victory due to the annihilation of the Liberal Democrats and the surging SNP. Those very same 2010 LD voters in austerity-hit areas, who shifted to UKIP in 2015 and supported Leave in 2016, by 2017 were much more likely to express regret over having voted to Leave and are unhappy with the UK leaving the EU. This is very consistent with my characterization that a significant share of the Leave vote was indeed a protest vote and that for a sizable chunk of UK voters, the 2016 Leave vote had little to do with the UK’s relationship with Europe. The fact that the elections prior to 2016 were affected by the economic and social effects of austerity is key to understand why a referendum was eventually called. This is the evidence basis upon which I argue that without austerity, there may not even have been a referendum, to begin with.
9. Outright rejection without engagement
There have been quite a few people who are prominent and vocal in the debate on Brexit who outright dismissed my paper (see, for example, Matthew J Goodwin here or here). I actually asked for their substantive comments on the paper but never received them. If a critique can’t be substantiated with evidence or analysis, it is not a critique – but an opinion. I respect opinions but there should be limited space for them in social science, as opinions do not advance the academic discourse. I worry a bit about social science as our shared objective as academics should be to advance the debate through actual analysis and evidence. At the heart of this problem may lie diverging views across disciplines as to “what constitutes evidence.”
I do not want to make absolutist statements. My paper, I think, shows quite compellingly that austerity matters at the margin. And that this margin is consequential – explaining around 6-11 percentage points of the 52 percentage point Leave vote in 2016. That does not imply that I do not think culture, perceptions of immigration, campaigning, party-political strategy and rhetoric as well as the media more broadly do not matter – they obviously do. But as of now, we have limited work showing exactly through what channels these causally affected individuals voting decisions (or turnout intentions). Most academic work is really hard, difficult and requires a lot of time. I worked for more than a year on this paper before circulating it. There is a worrying trend within social science: just like political populism, there are “populist” interpretations of social phenomena within academia, often with limited evidence to back up these “populist” interpretations.
This post represents the views of the author and not those of the Brexit blog, nor LSE. Image by Julian Stallabrass, licensed under the Creative Commons Attribution 2.0 Generic.
Thiemo Fetzer is an Associate Professor in the Department of Economics at the University of Warwick. He is a Visiting Fellow at the London School of Economics and is also affiliated with the Pearson Institute at the University of Chicago, the Centre for Competitive Advantage in the Global Economy (CAGE) at Warwick and the Centre for Economic Policy Research (CEPR) in London.



A quick response to Fetzer’s slur against Noah Carl: he has successfully crowdfunded his campaign to mount a legal challenge against St Edmund’s College for unfair dismissal (https://supportnoahcarl.com). Many prominent academics, including the Princeton moral philosopher Peter Singer himself on the Left of the political spectrum, deplored the academic mob which caused his dismissal (https://quillette.com/2019/05/02/cambridge-capitulates-to-the-mob-and-fires-a-young-scholar/, https://quillette.com/2018/12/07/academics-mobbing-of-a-young-scholar-must-be-denounced/)
Now to the paper.
I am receptive to the account that the austerity measures during 2010-2016 contributed – alongside a multitude of other factors (e.g. perception of EU from eurozone crisis 2011-2012, negative reaction against the Migrants crisis 2014-2017, Angela Merkel’s open-door policy to migrants, rise of nationalistic sentiments, high-profile cases of terrorism & criminality in Europe involving migrants, liberal immigration policy under the previous Labour government) – to the Leave vote, by creating economic dissatisfaction which some Leave voters somehow misattributed to membership of the EU. However, I would question: (1) the author’s quantification of as much as 9.5% of the Leave vote could be traced to austerity measures; (2) his attribution of the increase in UKIP votes in the local elections and general election primarily to austerity measures and curtailment of the welfare state, without controlling for other socioeconomic variables such as average income levels, level of immigration in the district, level of manufacturing, educational level and other variables commonly used to explain support for UKIP; (also control for level of dependence on welfare state as of 2010; suppose change in UKIP support is strongly correlated to financial loss from the Welfare Reform 2012 Act and other austerity measures, one cannot say this is evidence the cause is austerity as impact of austerity is strongly correlated on pre-existing level of reliance on public services & welfare, so both the level and change in the level need to be included in regression variables) (3) his reliance on research by Beatty and Fothergill (funded by Oxfam and Joseph Rowntree Foundation, both of which have organisational bias towards support for welfare state) to quantify effect of austerity according to UK constituencies.
(1) “9.5 percentage points lower…had the austerity shock not happened.”
The extent and speed of austerity, especially in light of the leeway given by sharp and continually reduction in UK government borrowing costs since 2010, probably was a political choice, but having to implement some form of austerity by reducing public expenditure as most EU countries had to do given high deficits and debt levels following the Great Recession, probably was not. The UK deficit in 2010 was 10% of GDP. Had it stayed this level during 2010-2016, it would have added 60% to debt all else equal, with risk of sovereign debt crisis if nothing was done. At the 2010 election, all the 3 main political parties acknowledged of the need for some form of austerity (see for example the party leaders debates in 2010). So while the extent and pace of austerity were up for debate, the necessity for austerity was not. Hence the question that needs to be answered here is not the counterfactual “had austerity not happened” (not a realistic option given the impact of the recession), but “had the extent of austerity been more moderate” (or greater reliance on tax rises than spending cuts to reduce the deficit), would UKIP experienced a smaller rise in support, and would the Leave vote been lower. It is plausible that a moderate form of austerity, given severity of the recession and stagnation of wages in public and private sectors, would still have created economic discontent and drove voters to the anti-establishment party UKIP – even if Fetzer’s hypothesis is correct. Moreover there are reasons to doubt his hypothesis: the rise of UKIP as a reaction against austerity fails to explain why those new UKIPers didn’t instead flock to the Green Party which was most opposed to austerity and portrayed itself as an anti-establishment voice on the Left.
While UKIP voters overwhelmingly voted for Leave, it does not follow that had the UKIP voters voted for another party, they would have voted to Remain. Leave voters were drawn from all the major parties including the pro-EU party SNP. Hence UKIP voters could have characteristics that drew them to vote Leave, even if they counterfactually did not vote UKIP. Therefore the 10% headline grabbing estimate is likely to be a gross over-estimate.
The EU Referendum exposed a dimension in UK politics that cuts across the traditional Left-Right divide framed around the size of the state. The new dimension can be characterised as divide between electorate with nationalistic sentiments versus those with global outlook. This cross-cutting means the referendum results are amenable to both a leftwing (e.g. blaming austerity) and rightwing (e.g. blaming immigration) narrative.
(2) Was the rise in support for UKIP in the elections prior to the EU referendum attributable to curtailment of the welfare state?
UKIP under Farage’s leadership is commonly classified as a rightwing populist party. UKIP policies at 2015 General Election proposed even more severe austerity measures than the Conservative: “Ensure Treasury sticks to plan of eliminating the deficit by the third year of the next parliament, with a surplus after that”, “Lower the cap on benefits”, “Limiting child benefit to two children for new claimants”. Either UKIP voters were pretty ignorant and were lured into voting for a party advocating policies against their own preferences, or they genuinely supported curtailment of the welfare state. UKIP proposed many policies to cut welfare state (e.g. in-work benefits) targeted at immigrants, and talked much about slashing Foreign Aid budget. UKIP voters probably have more nationalistic sentiments than the average voter. Factors other than reaction against austerity could plausibly account for rise of UKIP since 2010 and prior to the referendum: perception of EU from eurozone crisis 2011-2012, negative reaction against the Migrants crisis 2014-2017, Angela Merkel’s open-door policy to migrants, rise of nationalistic sentiments, high-profile cases of terrorism & criminality in Europe involving migrants.
(3) Impact of austerity by UK constituencies
Can we infer the attitude of UKIP voters to austerity from the 2017 General Election, when the UKIP vote collapsed? It appears roughly half of the collapse in UKIP vote at 2017 GE went to Labour (with policies signalling end of austerity) and other half to Conservative (continuation of austerity). The split is not uniform across constituencies – it appears in many areas of southern England, a larger share of UKIP vote went to Labour, whereas in northern England, a larger share went to Conservative. This pattern doesn’t fit the impact of austerity map cited by the author.
I am not persuaded by Fetzer’s hypothesis that UKIP support is explained by UKIP voters’ experience of and reaction against austerity and welfare cuts, nor the importance he assigned to the level of UKIP support across UK constituencies in explaining the Leave vote. Reasons for my scepticism include: (1) the welfare cuts in his study e.g. bedroom tax, disability living allowance, council tax benefit affect only a small percentage of population, unlike the 26.6% of UKIP vote share in EU elections 2014, or the 13% in UK GE 2015, hence it seems implausible these welfare cuts accounted for a large part of UKIP support; the impact of austerity map cited by Fetzer ignores other explanatory variables – which are correlated with impact of austerity – such as % unemployment, average wage levels, level of low-skilled immigration (crucial to differentiate different types of immigration as explanatory variables e.g. immigration impacts on London in different way from northern England); (2) UKIP manifesto 2015 proposed more severe austerity policies and more welfare cuts than the Conservatives; (3) I am sceptical the British welfare state has ever been well-designed and well targeted to compensate and pacify the losers to globalisation (if anything, it seems some types of welfare benefits exasperate resentment towards e.g. from UKIP’s GE2015 policies and David Cameron’s negotiations with EU post 2015 election, it appears some of the electorate with anti-EU sentiments, resent the fact in-work benefits are given EU migrants, hence increasing in-work benefits when UK remains part of EU could exasperate anti-EU sentiments); (4) the migration metrics by districts may be inappropriate e.g. location of national insurance registration may be a poor indicator of where the migrants end up working beyond the short-term; (5) the analysis by Clarke & Goodwin (2017) shows that given tightly of the Leave vote and the multitude of statistical significant factors driving the vote, any small change in any one of the factors could have tipped the balance. Hence once can equally if Boris Johnson did not lead the Leave campaign, or if Labour membership elected a pro-European party leader in 2015 (hence Labour voters during the referendum campaign would have no doubt of the overwhelming party stance), or if Angela Merkel did not unilaterally implement an open-door policy to migrants with impact on many EU countries, then the Referendum result could have turned out differently.