The impacts of the COVID-19 pandemic for industrial production and goods trade have varied across specific goods, services, and trade partners. Christine Arriola, Przemyslaw Kowalski, and Frank van Tongeren write that the unprecedented heterogeneity of changes in trade flows across products, sources and destinations signifies high uncertainty and adjustment costs, and requires additional incentives to adopt new — or to intensify existing — risk mitigation strategies.
The year 2020 was marked by some of the largest reductions in trade and output volumes since WWII. The declines in both world industrial production and goods trade in the first half of 2020 were of similar depth to those at the trough of the Global Financial Crisis (GFC). However, they materialised and disappeared more quickly, marking more of a V- shaped recovery in 2020. In addition, trade and production impacts across specific goods, services and trade partners were highly varied.
Initial pandemic-era expectations for a double-digit decline in world merchandise trade in 2020 did not materialise. Global trade turned out to recover from the shock at an extraordinarily fast pace from around mid-2020.
Figure 1. World merchandise trade and industrial production volumes (2010=100, seasonally adjusted)
Panel A. Trade volume (Index where 2010=100)
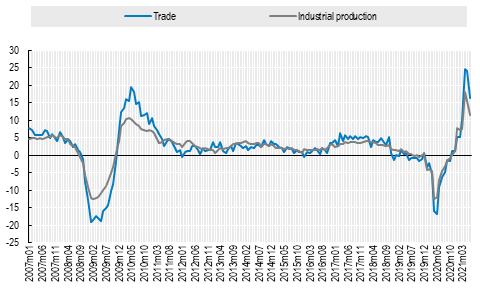
Panel B. Year-on-year growth rates (%)
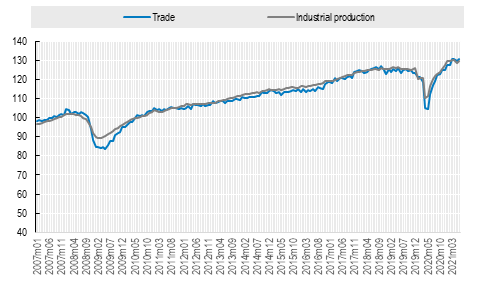
Source: OECD calculations based on data from CPB, Netherlands Bureau of Economic Analysis.
However, the trade collapse did not hit all products to the same extent and the rising tide did not lift all parts of the global trade system equally. Trade impacts across specific goods, services and trade partners show a highly diverse picture. In our new OECD paper (Arriola, Kowalski, van Tongeren, 2021), we unravel some of the detailed changes in the product composition and geography of trade that occurred during the COVID-19 pandemic in 2020.
In 2020, trade in services declined more and recovered at a slower pace than goods trade. Not surprisingly, trade in travel and tourism services slumped dramatically, but trade in digitally delivered services, such as telecommunication and IT services, boomed. Overall, the value of exports of services in OECD countries declined in 2020 by 16.7%, twice as much as the value of goods exports, which dropped by 8.2 %. This was one factor underpinning the relatively large adjustments in output relative to those in trade, as services account for a larger share of the economy than their weight in international trade.
Trade in several types of goods and services plummeted, while that in others increased markedly. The product structure of merchandise trade changed significantly: trade in several products nosedived (e.g., fuels, aircrafts, cars, mechanical machinery, steel), while trade in some other products increased (e.g., protective equipment and pharmaceutical products, food, and ‘home nesting’ products such as domestic appliances and electronics).
Our analysis shows that the variation in trade impacts across the different product categories in 2020 was not only larger than during the GFC but also larger than in any other year in the past two decades.
Figure 2. Changes in trade of 20 most traded products
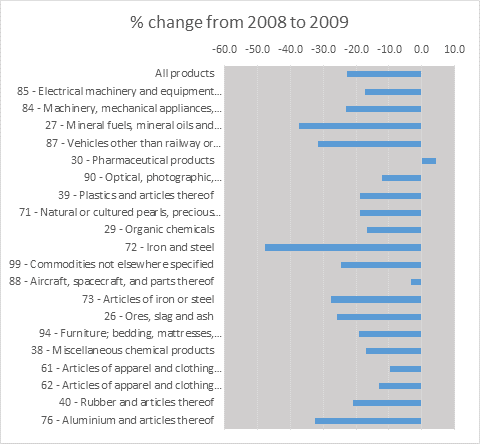
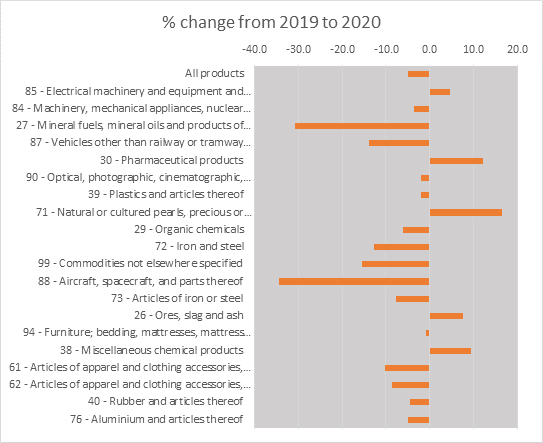
Note: the top-20 traded products ranking was established on the basis of value of trade (exports + imports) in 2019 exports across 37 largest economies for which product-level data for trade values is available for the whole 2020. These are: Argentina, Australia, Austria, Belgium, Brazil, Canada, Chile, China, Chinese Taipei, Czech Republic, Denmark, Germany, Finland, France, Hungary, Ireland, Italy, Japan, Kazakhstan, Korea, Malaysia, Netherlands, Norway, Philippines, Poland, Portugal, Romania, Russian Federation, Singapore, Slovakia, South Africa, Spain, Sweden, Switzerland, Turkey, United States and United Kingdom. The numbers in product descriptions are 2-digit HS codes. For a descriptions of all HS 2-digit codes, see the UN Comtrade Reference Tables. Source: Authors’ calculations based on ITC’s Trade Map database.
Some international supply chains came under pressure in the early months of the pandemic, but the data also show that supply chains were instrumental in the economic recovery in late 2020. Asia was at the heart of supply chain developments in 2020, with China seeing a significant expansion in its merchandise exports. The distance travelled by imported products also continued to increase in 2020, largely as a result of China and other Asian countries filling supply gaps resulting from lockdowns and changes in demand in other regions. These shifts occurred notwithstanding significant perturbations in the international transport sector.
Trade growth in 2021: new impetus or clearing the backlog?
Both the volume and (year-on-year) growth rates of world trade reached historical highs in May and June 2021. This is partially a reflection of the severe disruptions in trade in the first half of 2020 (leading to a low base), combined with the effect of releasing pent-up demand from 2020 and unwinding of the backlogs in international supply chains. Demand has resumed particularly in non-perishable goods, such as semiconductors, plastics, furniture, and bicycles, where production and delivery can be shifted across time.
That said, in many countries, after a period of temporary de-confinement at the end of 2020, the beginning of 2021 was again marked by a wave of lockdowns and restrictions, which weighed on demand, supply and international trade. The recovery during the first half of 2021 continued to be asynchronous across countries and its pace continued to evolve over time. The growth in China’s trade, exports in particular, was notably faster than that of other large economies in the second half of 2020 and early 2021. These factors complicate the assessment of the real overall strength of the trade recovery in 2021.
While it is still unknown which of the changes seen in 2020 will only be short-lived, some seem to suggest longer-term shifts or seem likely to result in long-term adjustments. Above all, the unprecedented heterogeneity of changes in trade flows across products, sources and destinations signifies high uncertainty and adjustment costs, and implies additional incentives for consumers, firms, and governments to adopt new — or to intensify existing — risk mitigation strategies.
♣♣♣
Notes:
- This blog post is based on “The impact of COVID-19 on directions and structure of international trade“, OECD Trade Policy Papers, No. 252, OECD Publishing,
- The post represents the views of its author(s), not the position of LSE Business Review or the London School of Economics.
- Featured image by Zoltan Tasi on Unsplash
- When you leave a comment, you’re agreeing to our Comment Policy.