The transition to a low-carbon economy carries potential ramifications for financial stability. If unanticipated, changes in climate policy and regulation, technology, and consumer and investor preferences can cause sudden market price readjustments. Javier Ojea Ferreiro, Juan C. Reboredo, and Andrea Ugolini have developed an empirical setup to assess various sets of scenarios. They write that an early warning indicator is essential to help identify the exposure of financial institutions to different transition paths.
The transition towards a low-carbon economy entails challenges and involves risks for the value of financial assets, with potential ramifications for financial stability. Changes in climate policy and regulation, technology, and consumer and investor preferences, if unanticipated, can cause sudden market price readjustments, which could have large implications for financial stability. Different transition scenarios could trigger different types of repricing effects, so identifying and quantifying the impact of those effects on financial stability has great interest for regulators, investors, and policymakers alike. The development of an early warning indicator is an essential tool that could provide useful information to identify the exposure of financial institutions under the materialisation of different transition paths that could not be seen outside the framework offered by a scenario analysis.
We develop an empirical setup to quantify the effects of climate transition risk on financial firms. Specifically, we model the distribution of financial firm returns conditional on the materialisation of different transition scenarios: disorderly transition, orderly transition, and hot house world.
Following the narrative from the Network for Greening the Financial System (2020), a disorderly transition scenario is featured by abrupt policy constraints on the use of carbon intensive energy that may cause operational difficulties for firms that are more exposed to risk, ultimately affecting the value of their assets (e.g., assets may become stranded). In contrast, firms with lower exposure to transition risk face a privileged position in the market (unless highly exposed firms in the meantime adapt their production processes to the new circumstance). As a result, market expectations regarding asset prices of firms with low exposure (green firms) curve upwards, with the opposite happening for the value of firms’ high exposure (brown firms). This impact can be described in terms of the quantiles for firm returns, assuming that green portfolio returns are above its highest value and brown portfolio is below its lowest value. In a hot house world scenario, policy actions to favour transition are implemented slowly and tardily, and investors adjust their expectations accordingly. As brown firms have more time to offload stranded assets without suffering a large price impact, brown asset prices increase, while green asset prices decline as green firms lose the opportunity to boost their business. Thus, the relative price impact of a hot-house world scenario can be described in terms of brown portfolio returns being above its highest value and green portfolio returns below its lowest value. Finally, in the orderly transition scenario, policy constraints to meet climate transition goals are implemented smoothly, allowing firms to progressively adapt to the new business setting. Investors would expect, therefore, asset returns to move around their median values (i.e., with no abrupt price changes).
We identify three market portfolios: green, brown, and neutral, which are featured in terms of their exposure to carbon transition risks using the information of their carbon risk score (CRS) rating computed by Sustainalytics. We refer to brown/neutral/green portfolio to indicate those portfolios with high /medium /low climate transition exposure in order to prevent cumbersome notation. We build annually the brown (green) portfolio using the highest (lowest) quintile from the cross-section distribution of CRS from a dataset of more than 900 European listed firms. The neutral portfolio is built using the remainder assets. On the basis of the financial firm’s returns dependence with those portfolio returns, we can quantify the effect of each transition scenario on the financial firms’ value and unveil vulnerabilities of climate-related risk events.
Following the systemic risk literature (Acharya et al., 2017; Browless and Engle, 2017; Adrian and Brunnermeier, 2016), we measure the systemic impact using the climate transition expected return (CTER), the climate transition value-at-risk (CTVaR), and the climate transition expected shortfall (CTES) metrics. Those metrics are computed from the conditional distribution of financial firm returns. Chart 1 summarises the main measures built following our approach, which are technically similar to conditional risk measures (Adrian and Brunnermeier, 2016; Girardi and Ergun, 2013), even though in our setup the trigger is provided by the combined impact of green, neutral, and brown portfolio returns. (Further details about dependence structure, data, formulas, and mathematical proofs are provided in Ojea-Ferreiro, Reboredo, and Ugolini, 2022.)
Figure 1. Building climate transition risk measures
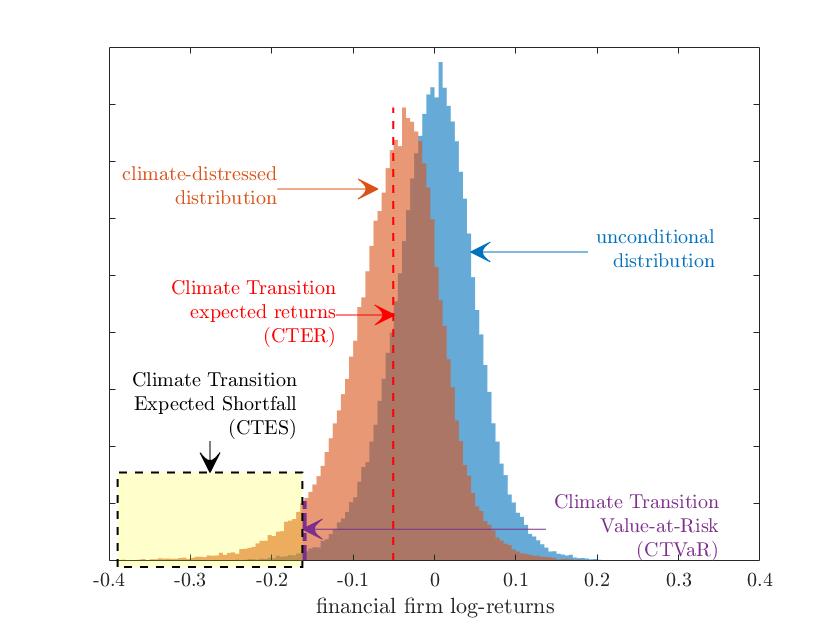
Notes: This figure summarises the goal of our framework, by setting stock market scenarios coherent with the NFGS narrative, we obtain the financial firm stock conditional distribution (orange bars) which would be different from the unconditional distribution (blue bars) when financial firm and stock market are not independent, from which the climate transition risk measures are computed, i.e., the mean value (CTER), a quantile of the distribution (CTVaR) or the mean value below a certain quantile (CTES).
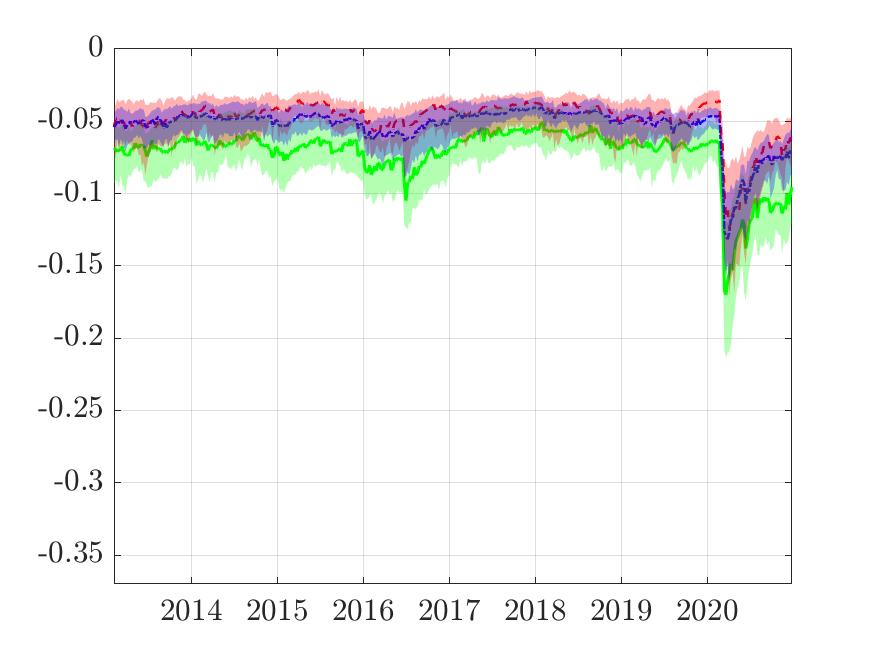
We present some results concerning the CTVaR at a sectoral level and the CTER at a country level for European financial institutions. Chart 2 presents the median CTVaR by subsector in the solid line, whereas the area indicates the cross-section interquartile range. (We have presented in this way the results because VaR is a non-additive measure, hence graphs are more informative when interquartile range is taken into account.) The behaviour of the European banking sector is different from the non-banking sectors, experiencing the highest losses in the hot house world scenario, while, in contrast, the remainder sectors experience much extreme losses in a hot-house world scenario. Also, the cross-section behaviour of financial firms seems to be more heterogeneous when they are in a hot house world scenario, as shown by the wider bands.
Figure 2. CTVaR at a sectoral level
Banks:
Insurance companies:
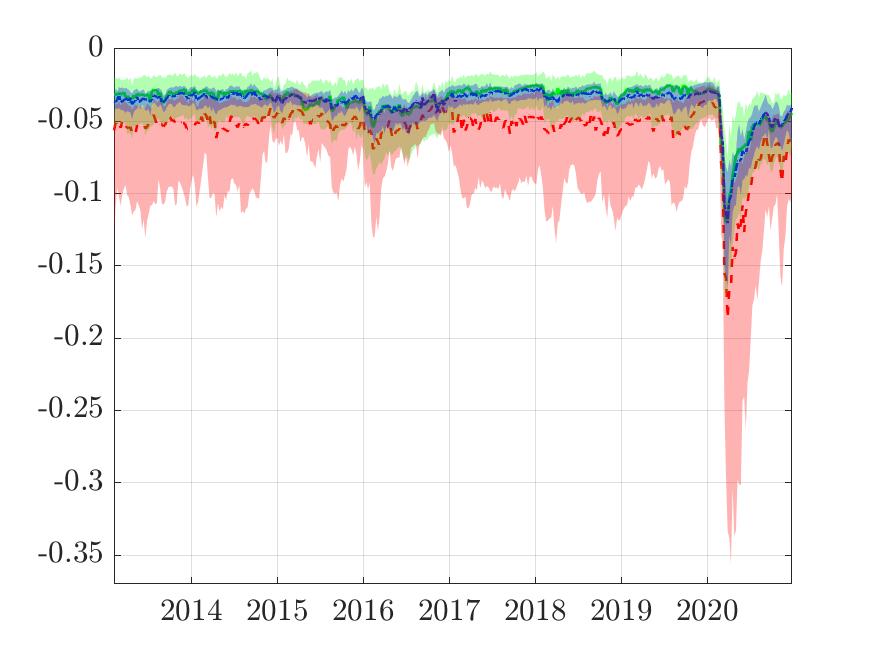
Financial services:
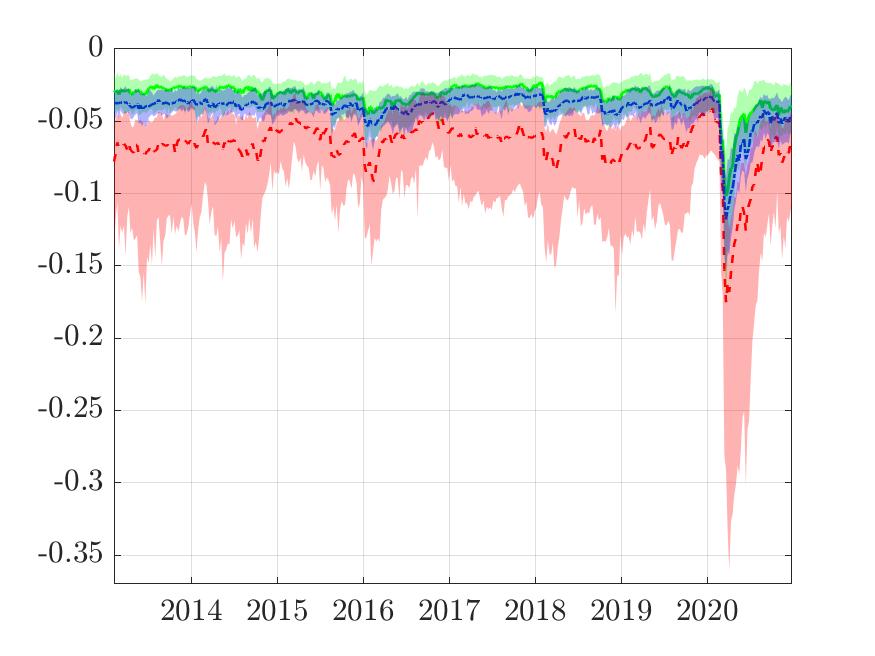
Real estate:
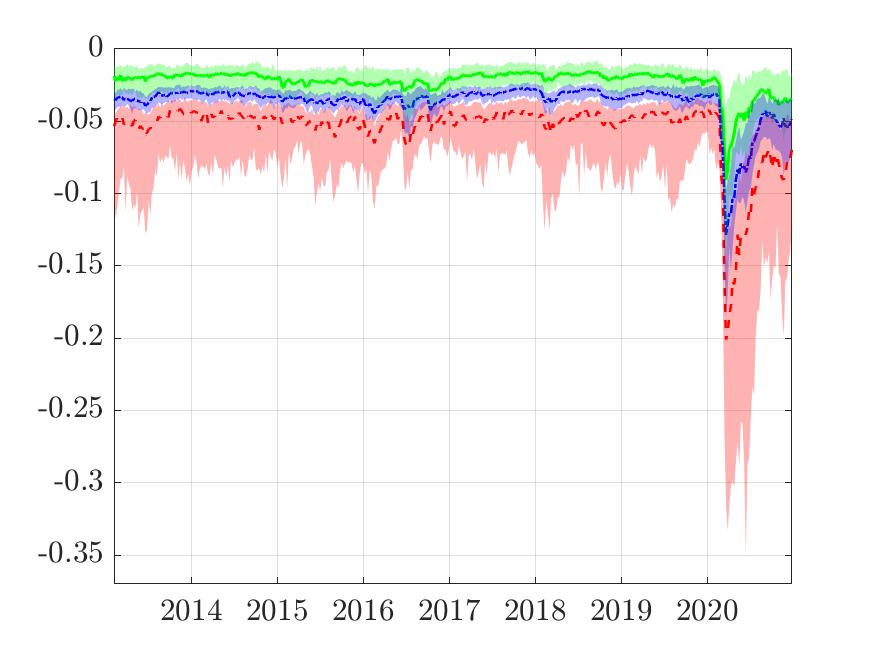
Sources: Ojea-Ferreiro, Reboredo and Ugolini (2022). Notes: These charts show the median CTVaR within each subsector (solid line) together with the interquartile range of the cross-section distribution (area). Red colour refers to the hot-house world scenario, green refers to the disorderly transition and the blue indicates the orderly transition. Each scenario has a distress of 0.2, e.g., in the disorderly transition scenario green portfolio returns are above the 80th percentile, whereas the brown portfolio returns are below the 20th percentile. The CTVaR is computed by looking at the 10th percentile of the conditional distribution.
Chart 3 displays the mean value of CTER over the sample period at the country level, with values aggregated using the relative market capitalisation. We can observe that Southern Europe, Ireland, and Poland are the countries most affected by the disorderly transition, whereas France, United Kingdom and Scandinavian countries are the most exposed in a hot-house world scenario. The losses (profits) in the hot-house scenario are 100 (500) basis points higher than the losses in the disorderly transition scenario, as shown by the heat bar of the figures. This is the result of the dependence asymmetries in the relationships with market assets.
Figure 3. CTER at a country level
Disorderly transition:
![]()
Hot-house world:
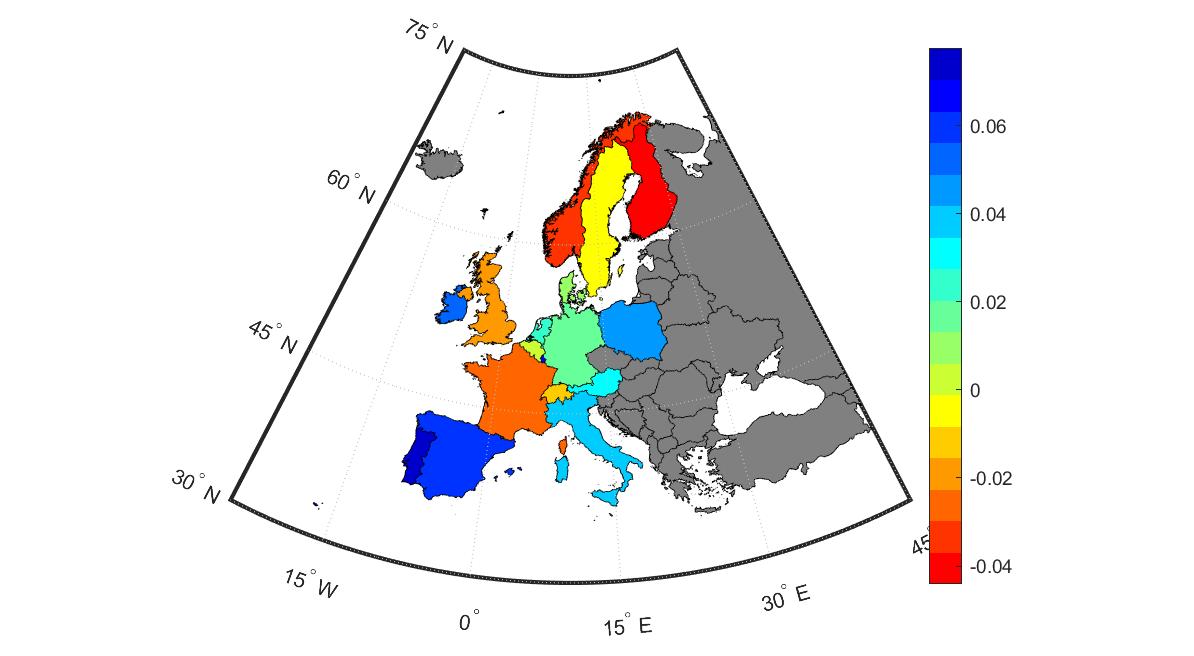
Sources: Ojea-Ferreiro, Reboredo, and Ugolini (2022). Notes: These charts show the weighted average CTER using the relative market capitalisation as a weight factor over the sample. Warmer colour means higher losses. Each scenario has a distress of 0.2, e.g., in the disorderly transition (hot-house word) scenario green portfolio returns are above the 80th (below the 20th) percentile whereas the brown portfolio returns are below the 20th (above the 80th) percentile.
By redefining the SRISK metric by Browless and Engle (2017) to our climate transition metrics, we can assess the impact of transition risk for capital. As shown in Ojea-Ferreiro, Reboredo, and Ugolini (2022), the highest capital losses in the banking sector occurs in the disorderly transition, where capital needs could reach 140 billion euro, which seems to be manageable by the European banking system.
Overall, our new empirical setup is easily replicable and flexible to assess different set of scenarios for the transition towards a low-carbon economy.
Authors’ disclaimer: The views expressed here are our own and do not necessarily reflect those of the European Commission.
♣♣♣
Notes:
- This blog post summarises The impact of climate transition risks on financial stability. A systemic risk approach, European Commission
- The post represents the views of its author(s), not the position of LSE Business Review or the London School of Economics.
- Featured image by Martin Reisch on Unsplash
- When you leave a comment, you’re agreeing to our Comment Policy.