UK retailers have been struggling to overcome a prolonged contraction in sales. COVID lockdowns practically brought the sector to a standstill and now inflation has been persistently eroding households’ purchasing power. Cesar Revoredo-Giha presents five takeaways on what the numbers on sales volume and inflation show us.
The retail sector is an important part of the UK economy. In 2020, the sector had an economic output of £97.0 billion — 5.2 per cent of GDP (down from 7.7 per cent in 2019). At the beginning of 2020 the country had 310 thousand retail businesses, which sustained three million jobs in 2019 (9.3 per cent of all UK employees). The sector also contributes to the economy with a number of services in product distribution and, in many cases, in the organisation of supply chains (for instance, food supply chains dedicated to a single retailer).
The retail sector’s performance reflects consumer demand. Here are seven charts showing the evolution of retailing since 2019 and the effects that persistent inflation has had on the sector.
Evolution of the retail sector
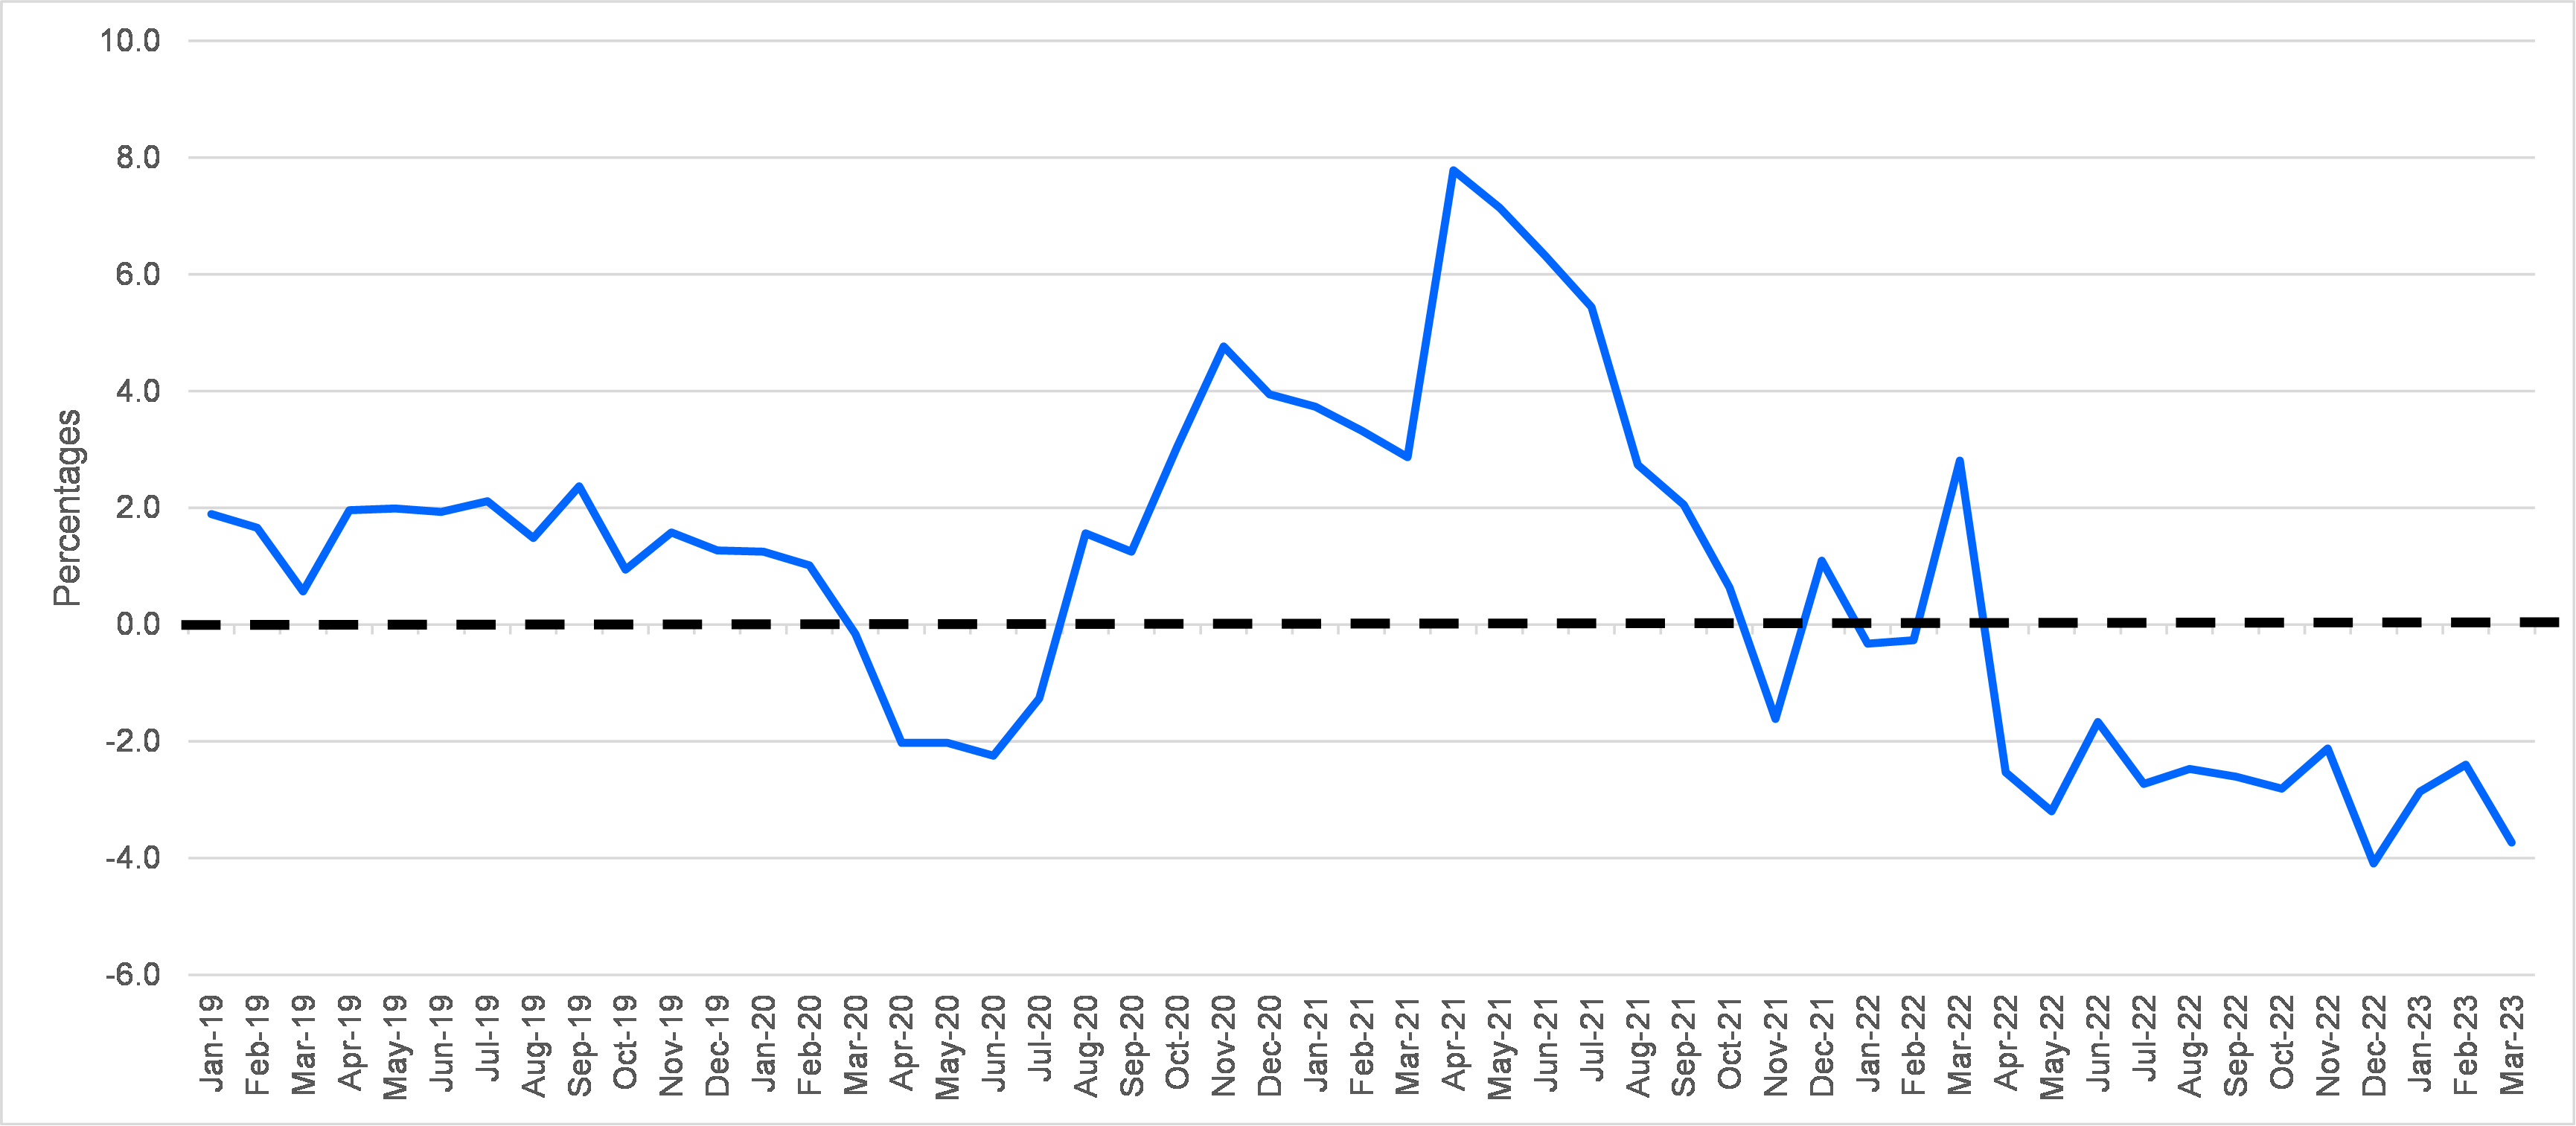
Figure 1 shows the annual growth of all retail volume (with and without automotive fuel) together with the annual inflation rate, from January 2019 to March 2023. The dotted lines highlight the jump in selling during the lockdown and the subsequent decrease, while inflation rates accelerated.
Takeaway 1: By eroding consumers’ purchasing power, inflation led to a drop in sales volume.
Figure 1. Annual growth in retailing, including and excluding automotive fuel (2019 – 2023)
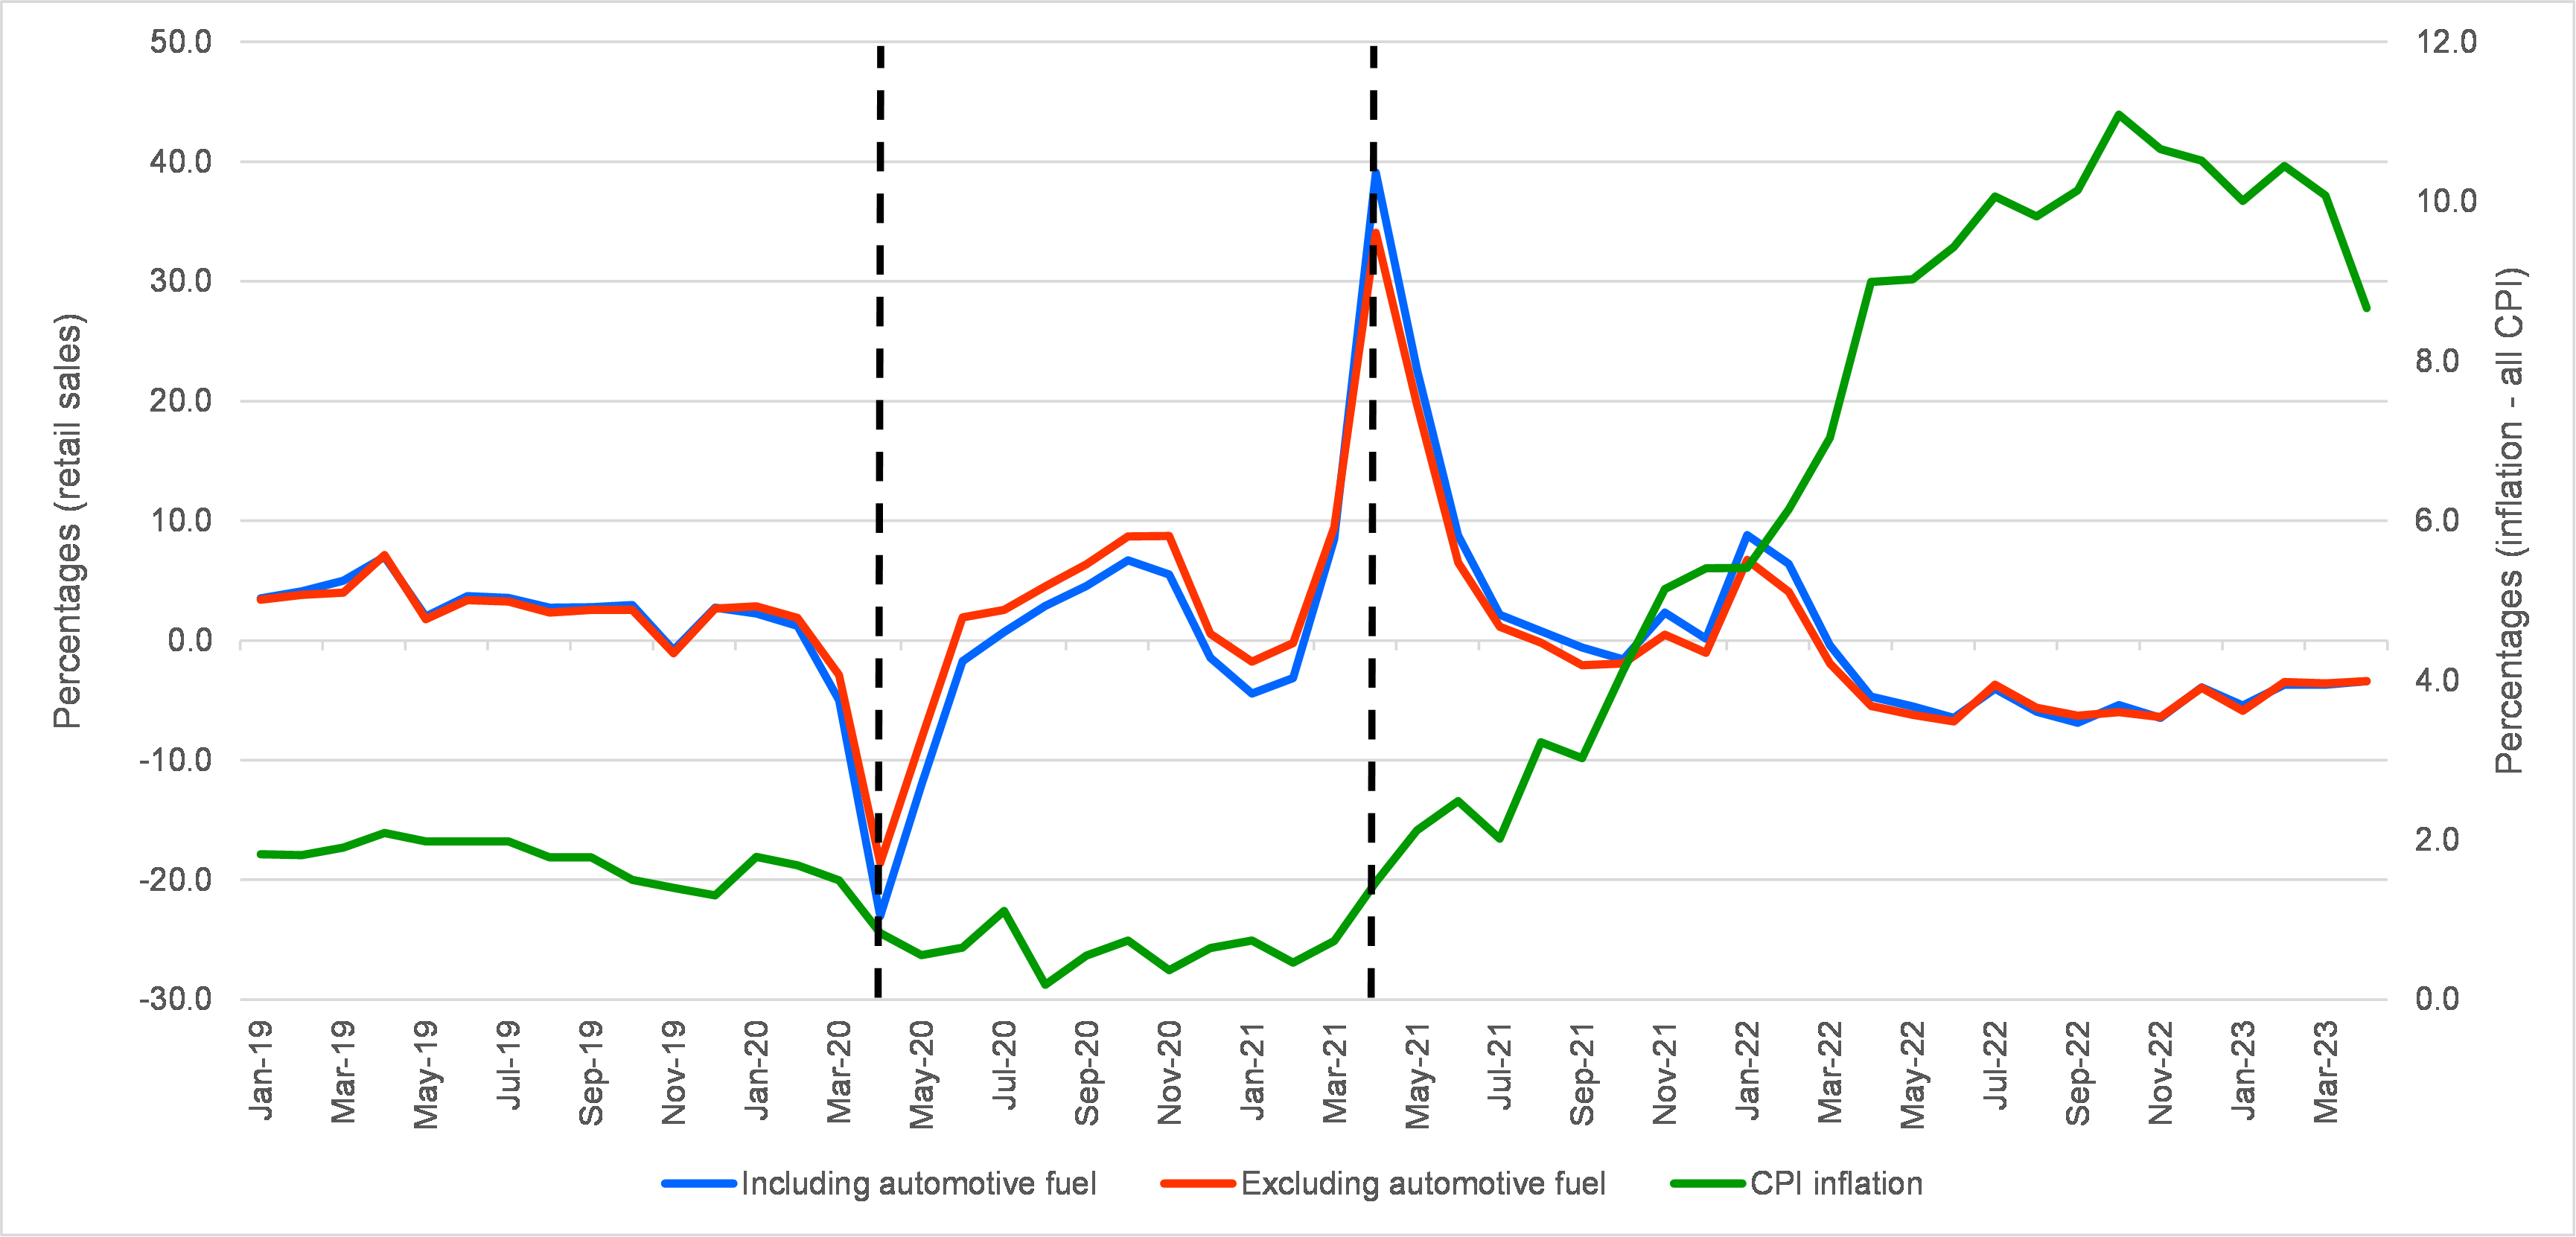
Source: Office for National Statistics
In many cases, people tend to refer to retailing in broad terms, masking the fact that it encompasses a variety of firms. Figure 2 shows that while the sales by predominantly food firms were stable since 2019, the predominantly non-food firms mimicked the behaviour of the retail aggregated series in Figure 1.
Takeaway 2: Predominantly non-food firms have been the most affected by the contraction in purchasing power.
Figure 2. Annual growth of retail sales by predominantly food and non-food stores, 2019 – 2022
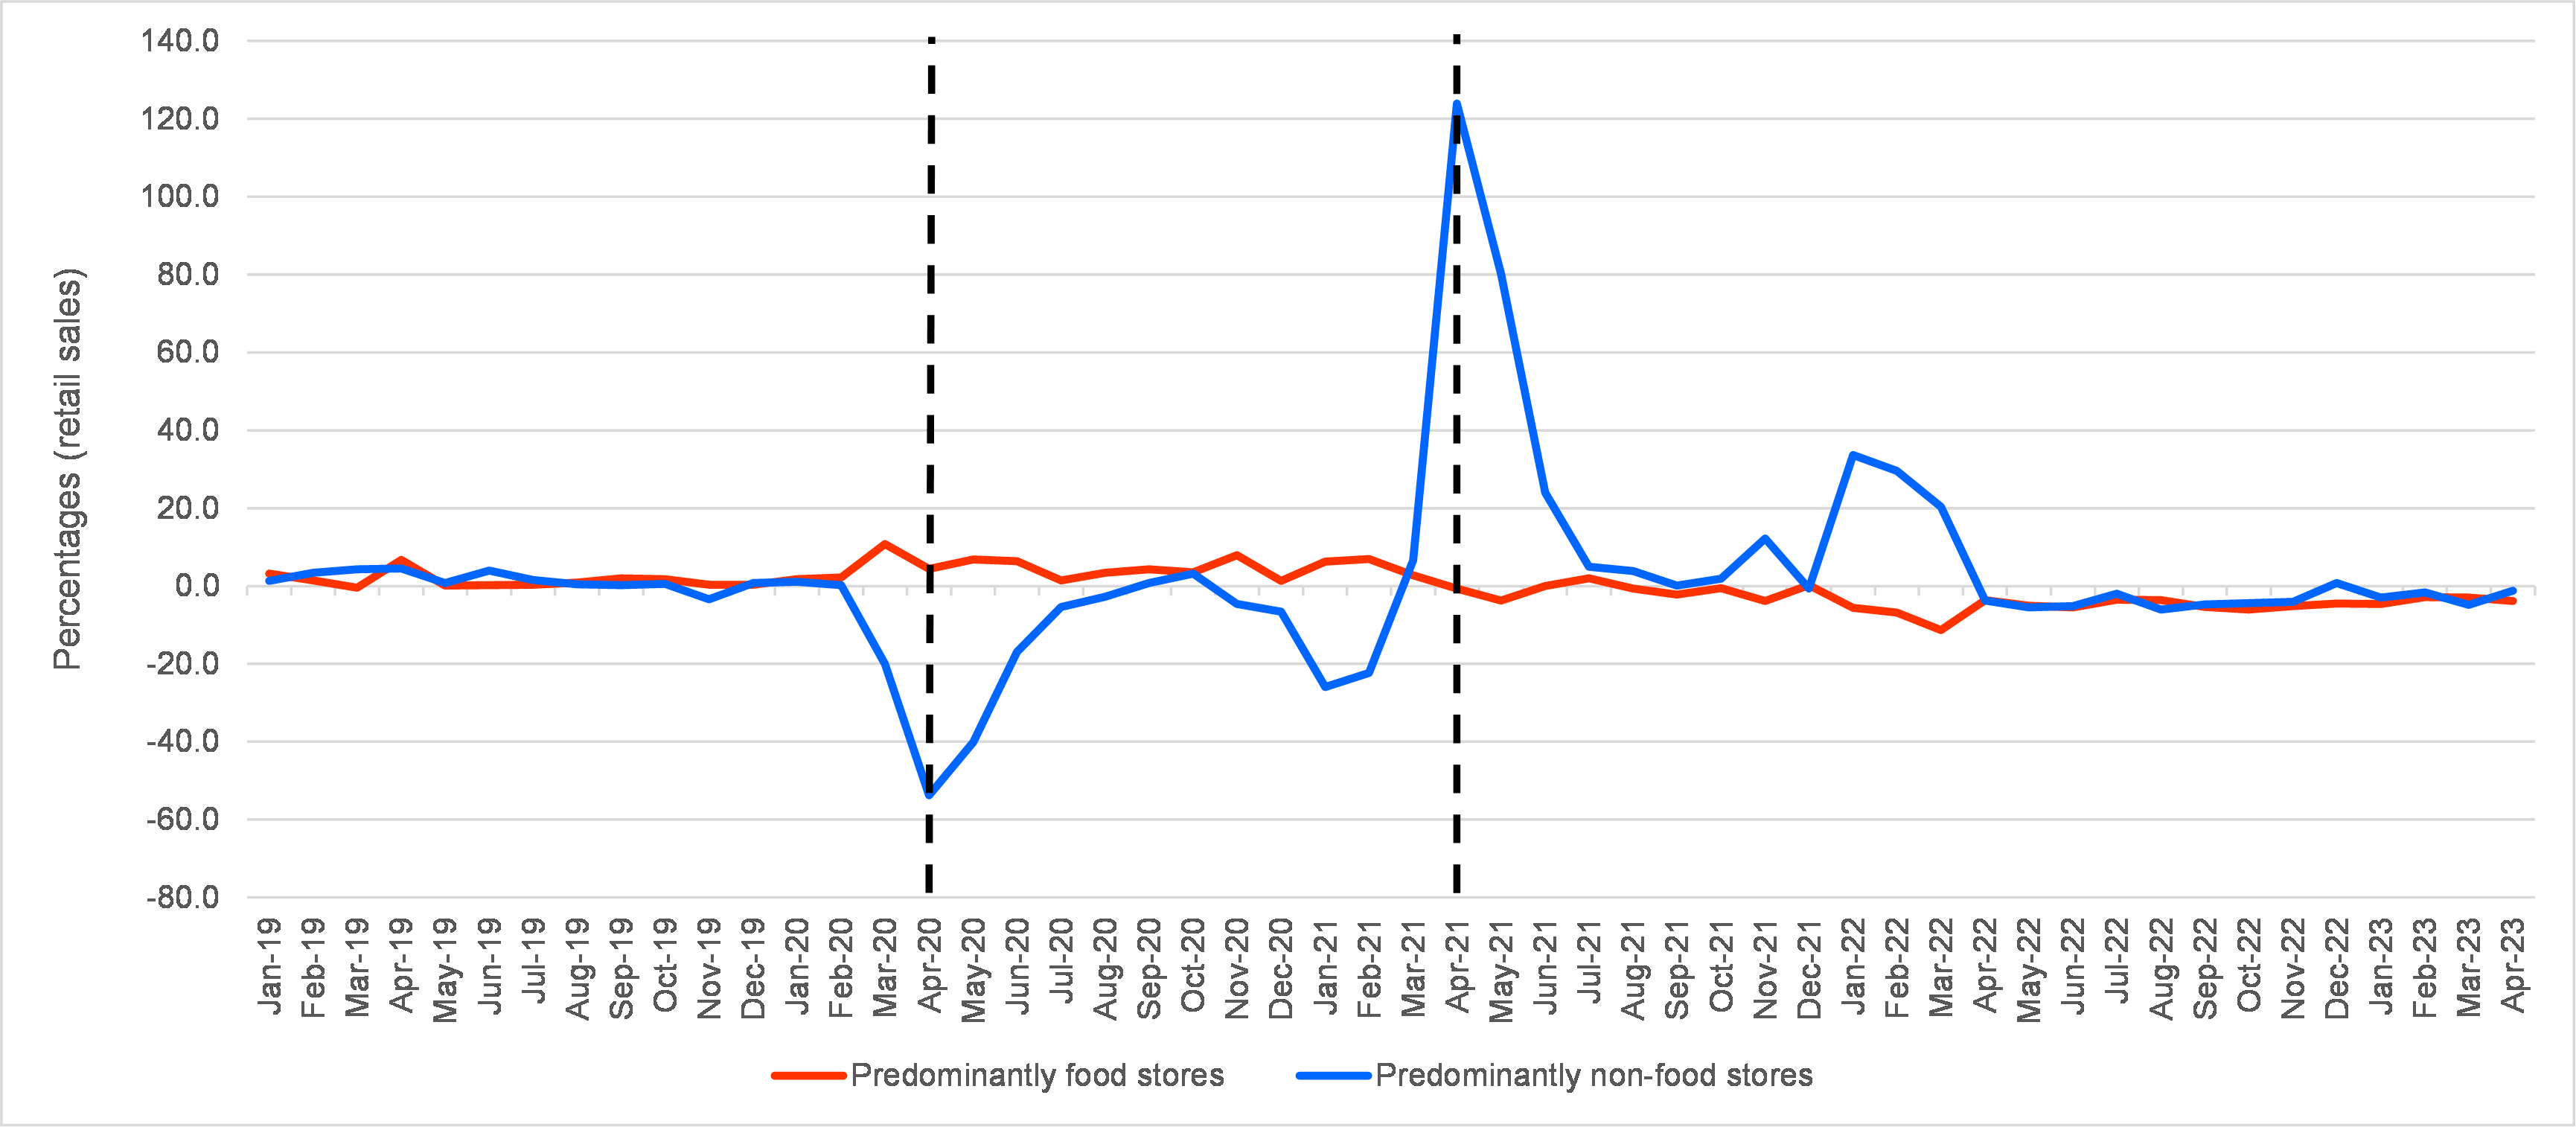
Source: Office for National Statistics
Figure 3 concentrates on the growth rate of the predominantly food stores, which comprise those that sell food but are non-specialised, those that are specialised and those focusing on alcoholic drinks.
Sales in non-specialised food stores grew close to zero, and since approximately April 2021 growth rates have become consistently negative. In contrast, sales in specialised food stores, which suffered in the beginning of lockdown, recovered and by March 2021 were already growing. This pattern continued for most of the remaining part of the studied period. Finally, sales of alcoholic beverages have fluctuated far more than in the other two sectors, with negative growth rates for most of 2022.
Takeaway 3: The contraction in purchasing power since 2021 has affected each sector differently: as a necessity, food has been less touched than alcoholic drinks.
Figure 3. Annual growth in sales of predominantly food stores, 2019-2022
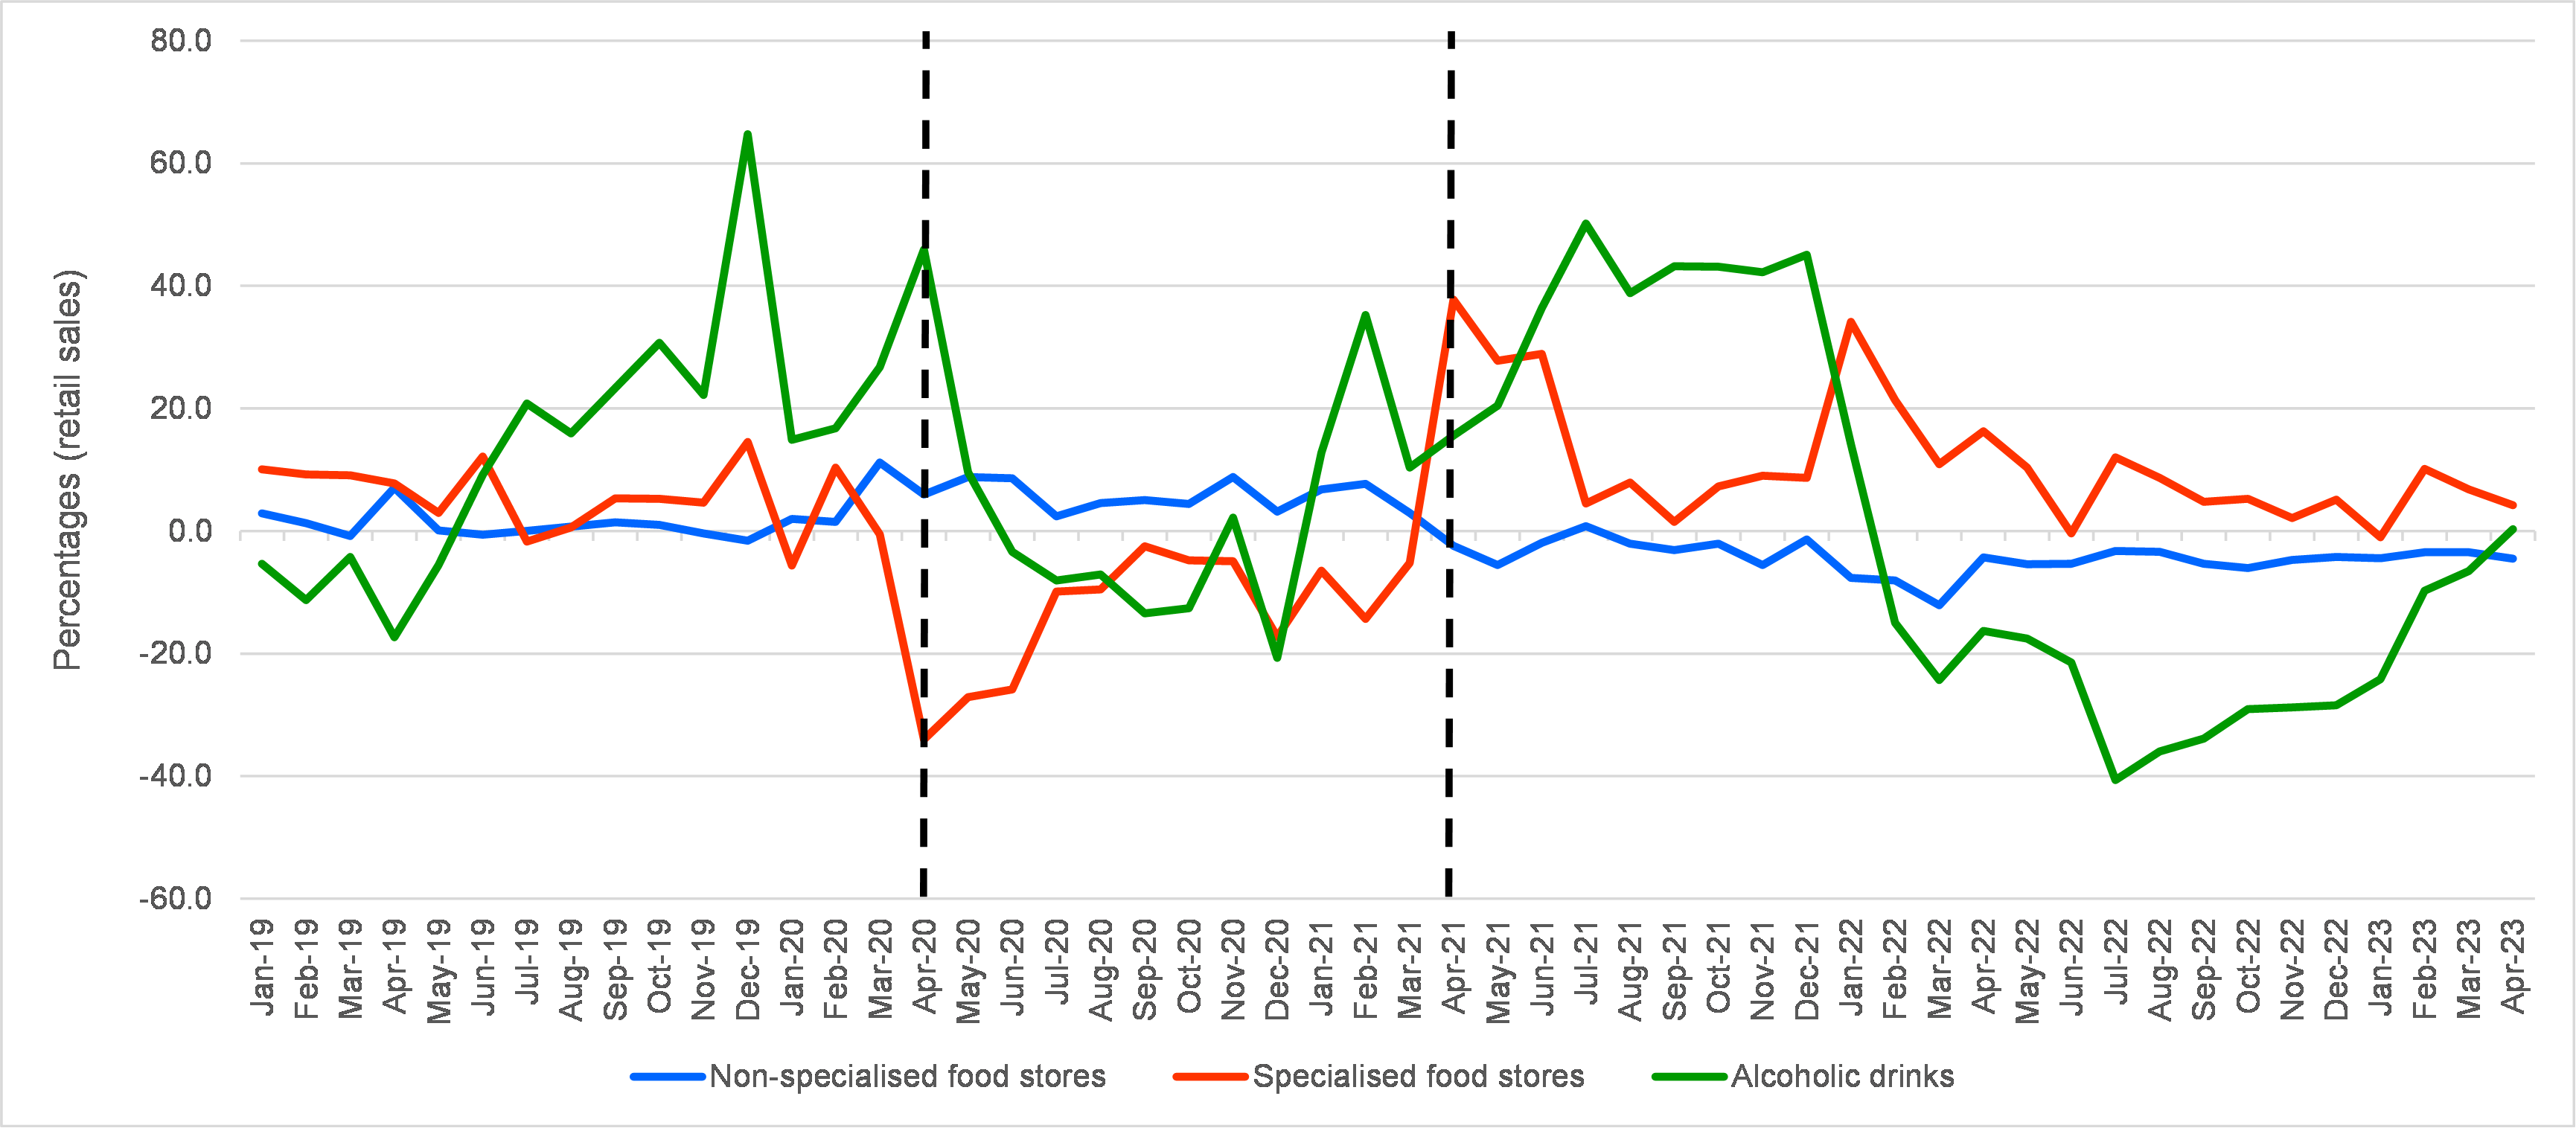
Source: Office for National Statistics
Another way to disaggregate predominantly food stores is by size. Figure 4 shows that large businesses make most of the evolution of the aggregated sector (blue line in Figure 4), whilst small businesses show a more variable performance. Nevertheless, in approximately May 2022 both show positive growth rates.
Takeaway 4: Small firms, even in the food sector, are more vulnerable to food inflation and higher energy costs.
Figure 4. Annual growth in sales of predominantly food stores by size, 2019-2023
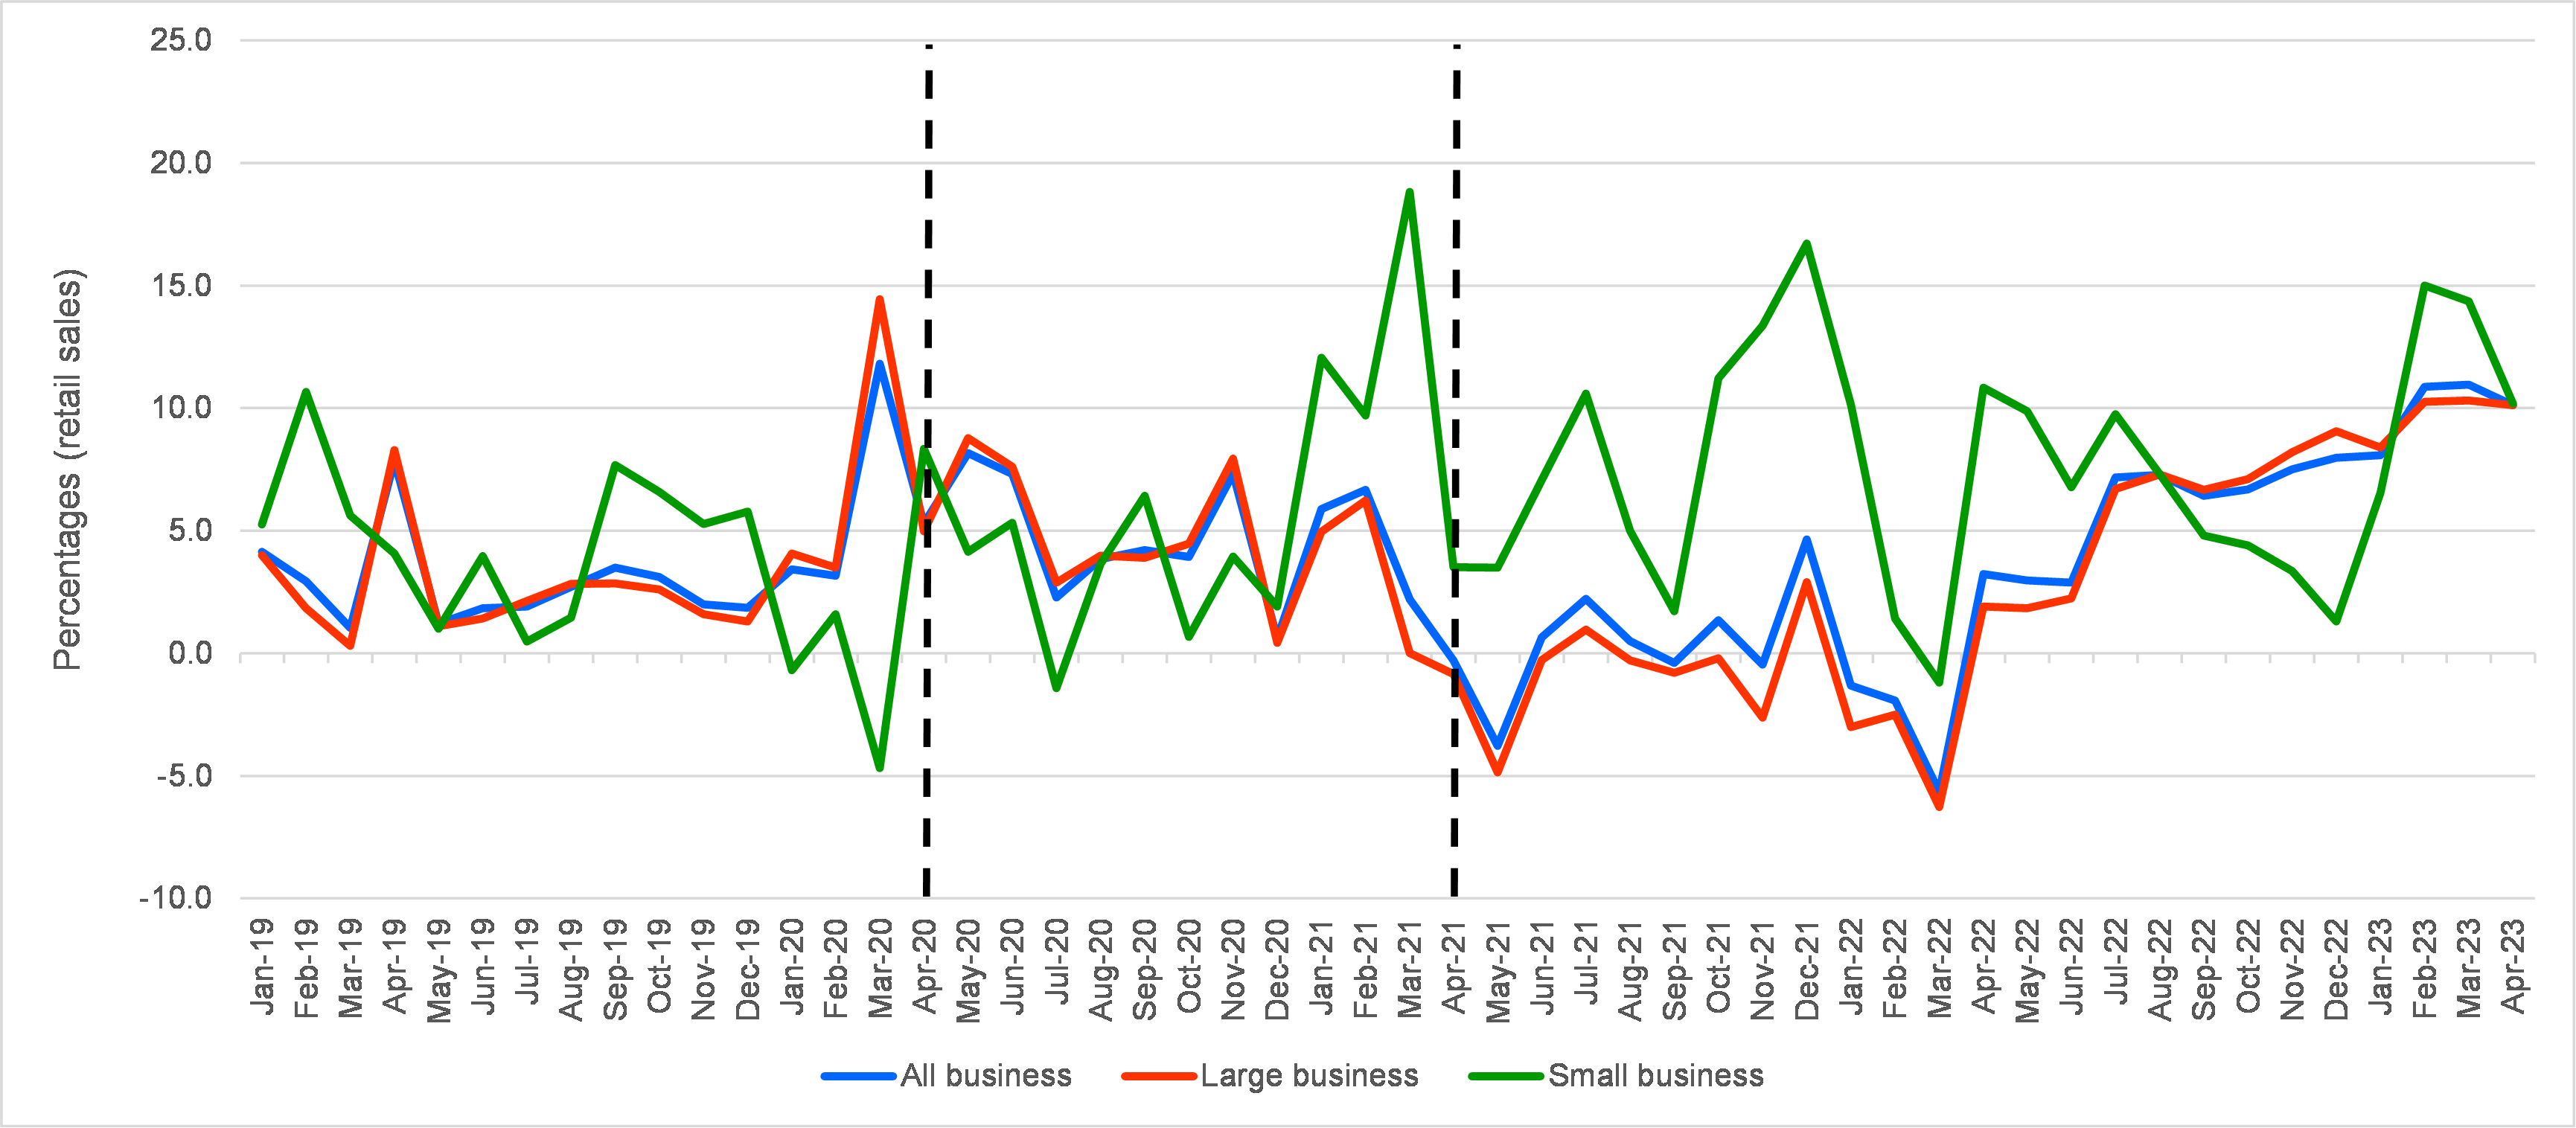
Source: Office for National Statistics
Internet sales are covered in Figures 5 and 6. Figure 5 shows the well-known growth in both food and non-food during the pandemic period with the contraction during the subsequent period. Figure 6, which takes a more long-term perspective, shows that after the pandemic both sectors seem to have returned to their historical trends (as a proportion of total retailing).
Takeaway 5: People seem not to want to do their shopping online as often as they did during lockdown. They seem to like a combination of different shopping experiences.
Figure 5. Annual growth in real terms of food and non-food internet sales – 2019-2023

Source: Office for National Statistics
Figure 6. Proportion of the food and non-food categories in internet sales, 2006-2023

Source: Office for National Statistics
The retail sector and consumers’ purchasing power
Although the “all items” consumer price inflation in April has somewhat decreased with respect to March (from 10.1 per cent to 8.7 per cent), it is still four times higher than the Bank of England (BoE) target of 2 per cent. However, more than just observing prices is important to study the evolution of consumers’ purchasing power, which brings together incomes and prices.
Figure 7. Annual growth of total real average weekly earnings (seasonally adjusted), 2019-2023
Source: Office for National Statistics
Since April 2022 (Figure 7), the annual growth in real earnings has been negative, which is consistent with the Government’s policy of increasing interest rates to reduce aggregate demand and control inflation. However, this may affect the evolution in real terms of the retail sector as shown in Figure 1.
Using a simple estimation, it is possible to illustrate and quantify the relationship between retail volume and consumers’ purchasing power. Thus, on the one hand, for predominantly food stores, a decrease by one per cent in consumers’ purchasing power leads to a decrease in the transacted retail volume by one per cent. For predominantly non-food stores, as one should expect due to their less necessary nature, the decrease is more significant (1.2 per cent).
Final thoughts
Inflation erodes consumers’ purchasing power, producing significant effects on retailing and on the supply chains associated with retailers.
The information provided above refers to aggregated/average cases. In this sense, one could expect that retailing in deprived or remote areas finds a more difficult situation. Even more so since retailing costs are particularly associated with prices, labour costs and energy.
Factors such as the increased proportion transacted on the internet will continue affecting the long-term situation of high-street retailing. However, after lockdown, retailers will need to be creative by capitalising, for instance, on consumers need for socialisation, since clearly people are not keen to conduct all their transactions online.
- This blog post represents the views of its author(s), not the position of LSE Business Review or the London School of Economics and Political Science.
- Featured image provided by Shutterstock.
- When you leave a comment, you’re agreeing to our Comment Policy.


thank you for the article