Limiting the length of lockdown is key to minimising the damage the pandemic inflicts on livelihoods. Matthew Adler (Duke University/LSE), Richard Bradley (LSE), Maddalena Ferranna (Princeton), Marc Fleurbaey (Princeton and Paris School of Economics), James Hammitt (Harvard) and Alex Voorhoeve (LSE) compare the benefit-cost and social welfare approaches to doing so. They find early suppression is often best, if it can be ensured that those on lower incomes bear a smaller share of the economic burden of lockdown.
The implications of the benefit-cost and social welfare approaches we described can be compared by drawing on a simple model simulating the pandemic over two years and the effects of two policies: suppression, which imposes a lockdown for as long as it takes to effectively eliminate the virus, and control, which limits the lockdown to periods where fatalities are over a certain threshold. It is assumed that contact reduction has a substantial economic cost, and that the discovery of a treatment or a vaccine comes only in week 70 of the pandemic.

The model exists in calibrations for several countries (Belgium, France, Guinea, the UK and the USA). Figure 1 illustrates the policy problem for the USA for one scenario, based on infection spreading from week 1 and a policy being adopted in a particular week and continued until the pandemic ends. The scenario parameters are as follows:
- the degree of contact reduction during periods of “lockdown” is 70 percent;
- the degree by which other measures (e.g. mask-wearing), if fully implemented, reduce contagiousness is 20 percent;
- and in the control policy, the threshold for re-imposing lockdown is 7000 deaths per week (or 1,000 deaths per day, roughly the point at which US public opinion appears to call for firmer contact reduction policies).
Both policies entail an economic cost (we estimate the percentage income loss during a period of lockdown at half the percentage of contact reduction). They also save lives. The graphs show the final outcome (both economic cost and fatalities) as a function of when the policy is initiated.
Consider suppression first (given by the solid lines). Early suppression starting in week 10 of the pandemic saves the most lives and, because the disease spread is still low, imposes a smaller economic cost than suppression a few weeks later. In that sense, “going in early and hard” is unambiguously superior to suppression somewhat later on. But once the disease is widespread, there is a stark trade-off between saving lives and limiting economic loss, because the former requires longer lockdown episodes.
In contrast, the impact of initiating a control policy (given by the dashed lines) is roughly constant throughout weeks 10-16 of the epidemic. After that, later implementation causes a stark rise in deaths, although it limits the economic cost.
Finally, comparing suppression and control, one sees that if implemented before week 20 of the pandemic, suppression saves far more lives than control, and often at the same or lower economic cost. Besides highlighting one clear lesson (if you go for suppression, go early), Figure 1 therefore shows that difficult trade-offs between lives and livelihoods are central to the timing of the intervention.
Figure 1: The policy problem
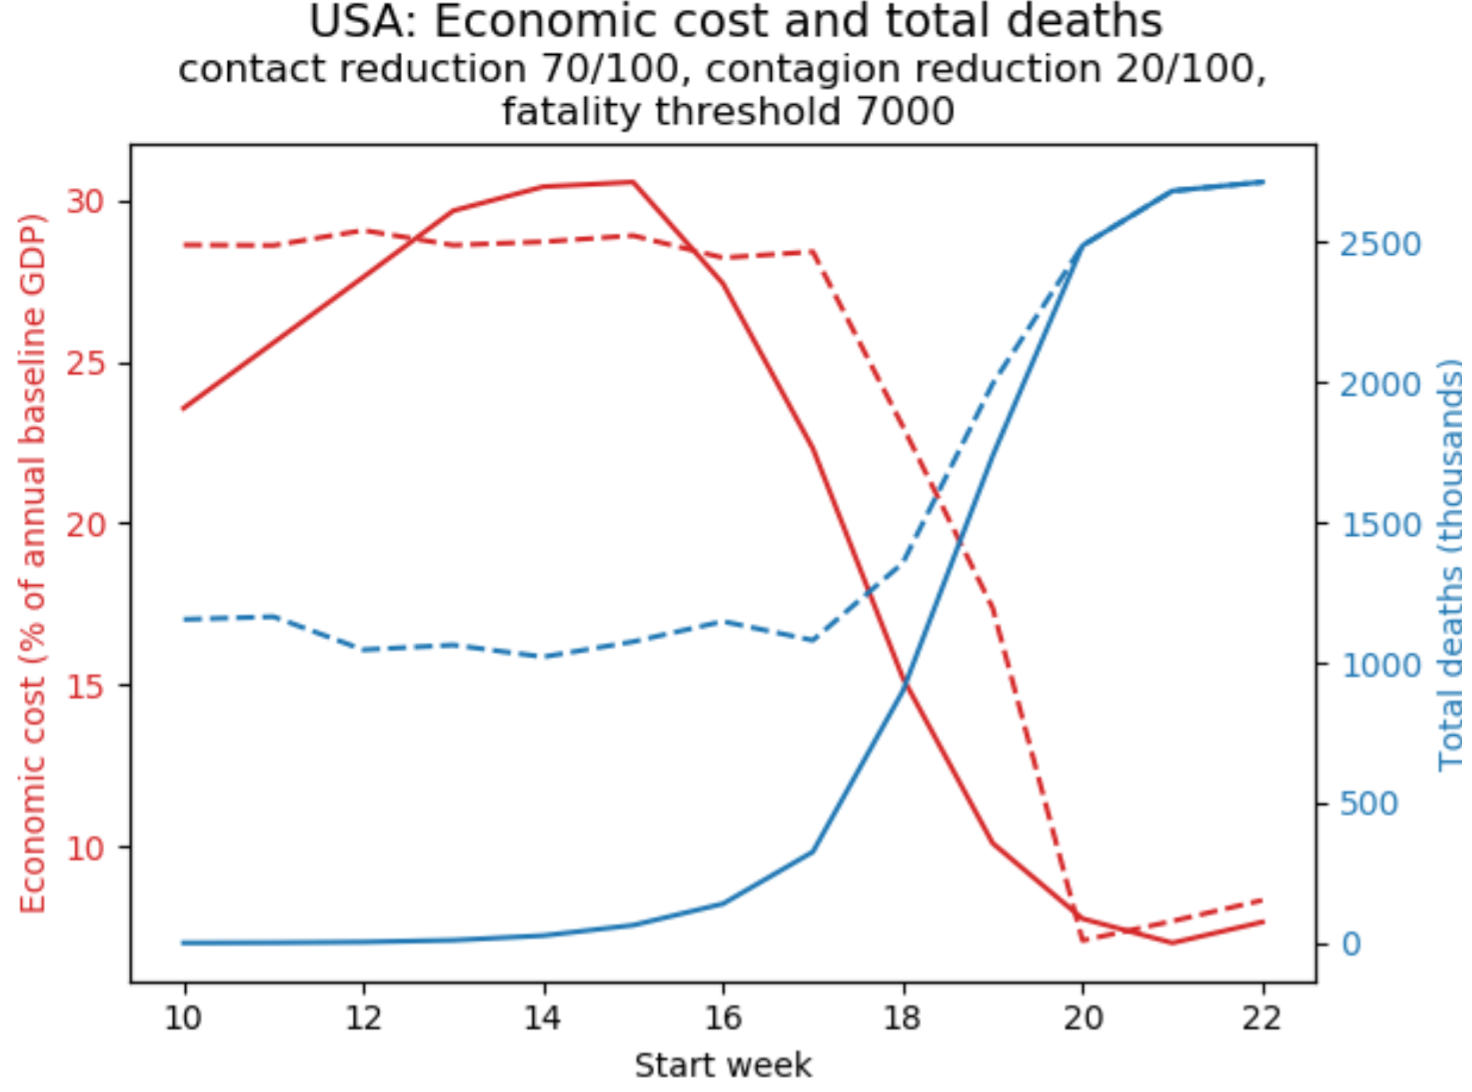
How to read the graphs: Solid curves describe the outcomes of the suppression policy, dashed curves the control policy; economic cost in red (left axis), total fatalities in blue (right axis).
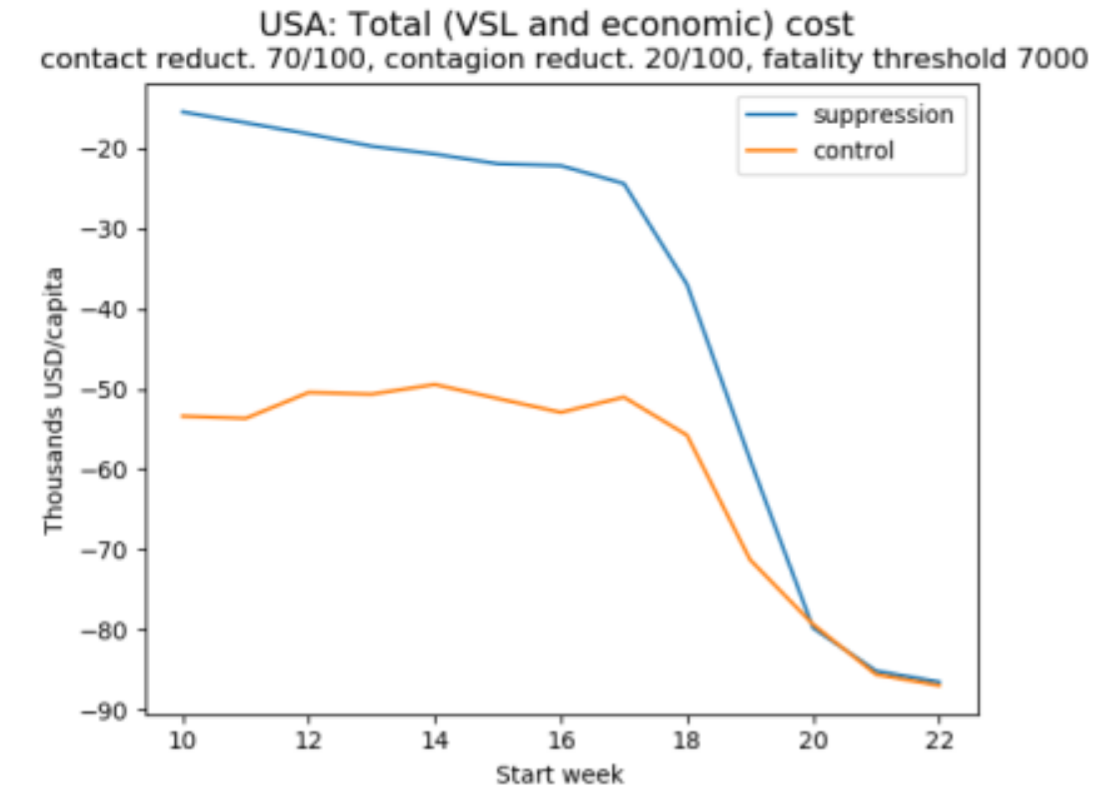
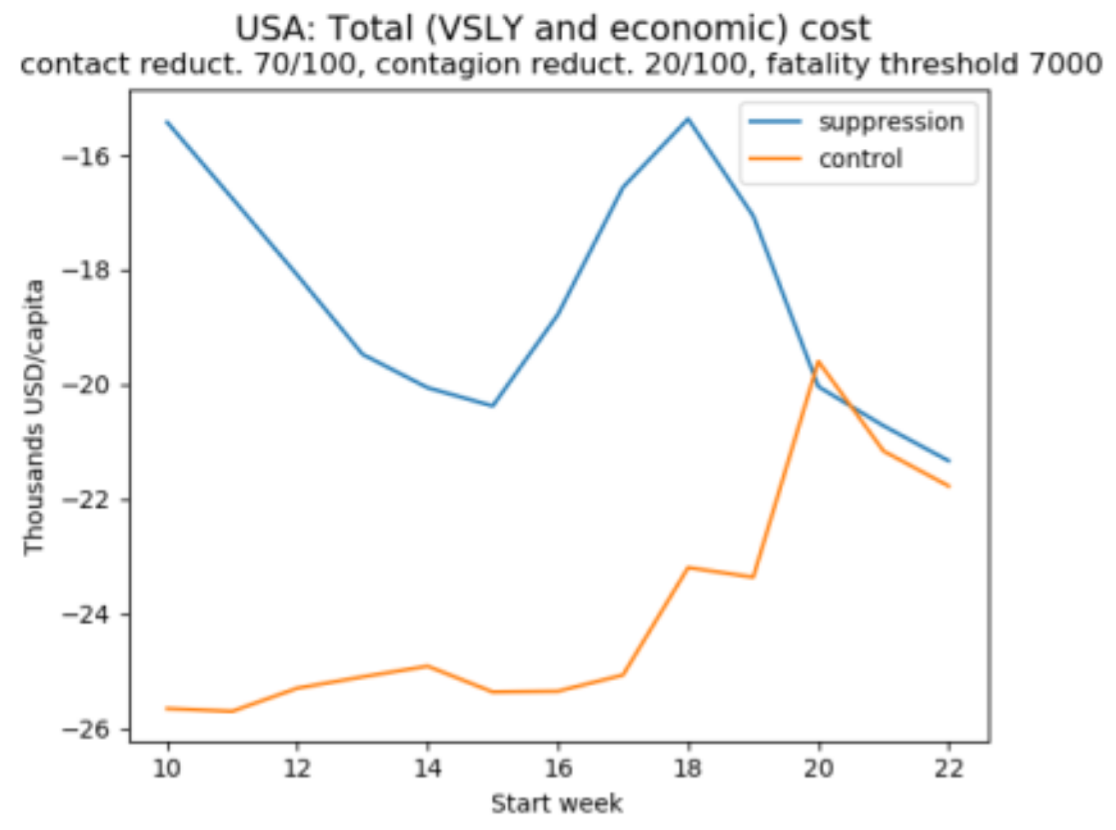
To illustrate how benefit-cost analysis resolves these trade-offs, let’s look at the contrast between an assessment of these projections based on the value of a statistical life (VSL) and one based on statistical life-years (VSLY). This is shown in Figure 2, which displays simulations of the total cost (the sum of the monetary value of lives lost to the crisis and the economic cost) as a function of when the policy is initiated.
Figure 2: Cost-benefit analysis
(a)
(b)
(c)
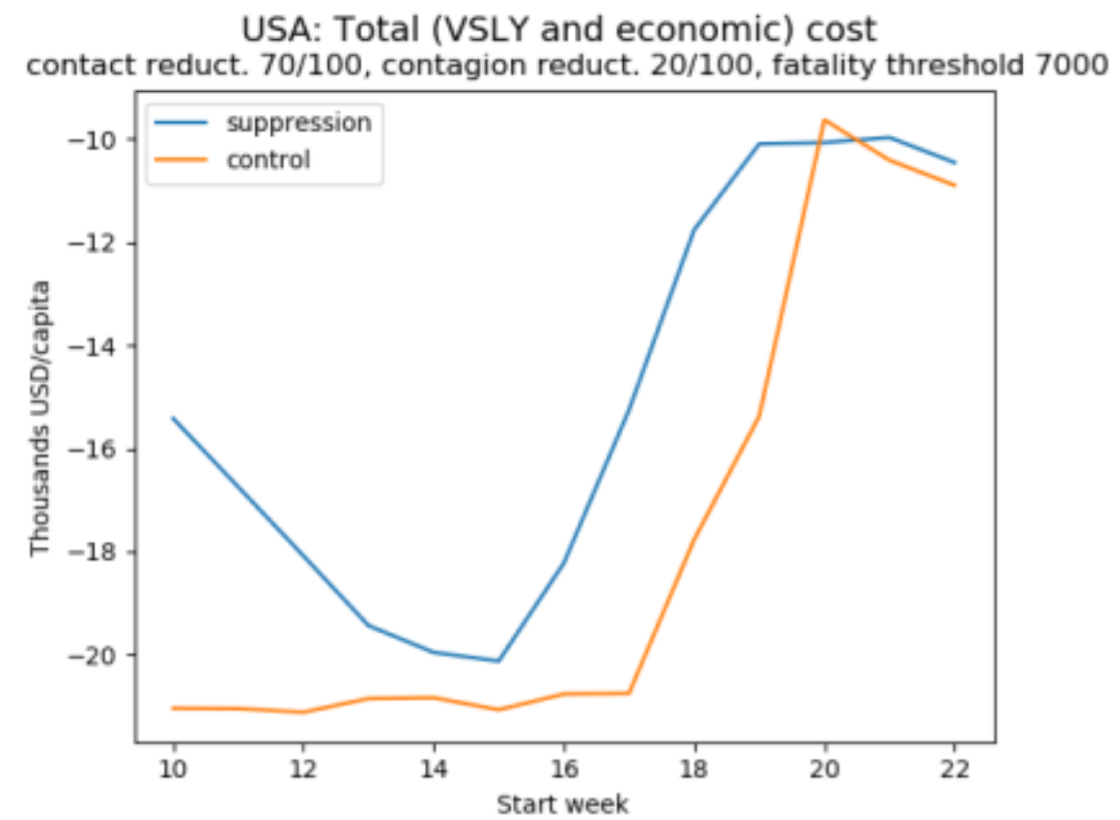
How to read the graphs: The vertical axis displays losses as negative numbers so that the higher on the axis, the better.
Figures 2a-b reveals that both methods favour suppression over control, since the total cost is minimised by the former. Figure 2a also reveals that if we focus on lives saved, then early suppression is clearly superior. By contrast, if we focus on life-years saved, as in Figure 2b, it is acceptable to let the virus spread somewhat before suppression (because in the USA, most victims are elderly and lose relatively few years of life). These two graphs rely on a value of a statistical life equal to 150 times the GDP per capita and a corresponding value of a statistical life year equal to 3 times the GDP per capita. But we noted before that these figures are disputed, and to illustrate how sensitive results are to this assumption, Figure 2c uses a lower value of a statistical life-year equal to one times GDP per capita (roughly what the UK government uses to decide which treatments to include in the NHS) – with the implication that, despite the staggering death toll, delaying policy adoption is reasonable and that very late adoption of either policy is optimal. This underlines the sensitivity of policy assessment in benefit-cost analysis to the value of life (or life year) adopted.
To facilitate comparison with a social welfare analysis of the same projections, we have chosen a measure of wellbeing which aligns with the one implied by benefit-cost analysis. Consequently, in the absence of priority for the worse off, social wellbeing analysis delivers a similar verdict as benefit-cost analysis. But when a degree of priority for the worse-off is introduced, they can differ markedly. In particular, because death results in considerable loss of wellbeing, social welfare analysis tends to give greater weight to health outcomes, something that is further accentuated when fatality rates are higher amongst those who are poor. Likewise, the verdict that social welfare analysis delivers on policies and when they should be initiated will be sensitive to how the economic burdens of their implementation are distributed.
This is illustrated in Figure 3, which uses a measure of societal wellbeing that values a situation by the per capita income which, when equally distributed and associated with equal longevity for everyone, would yield the same overall wellbeing as that situation. Priority for the worse-off (also called “inequality aversion”) is set such that if one individual is half as well-off as another individual, then it is four times more important to give a fixed, small increment in wellbeing to the less well-off person.
Figure 3: The social welfare approach with priority to the worse off
(a)
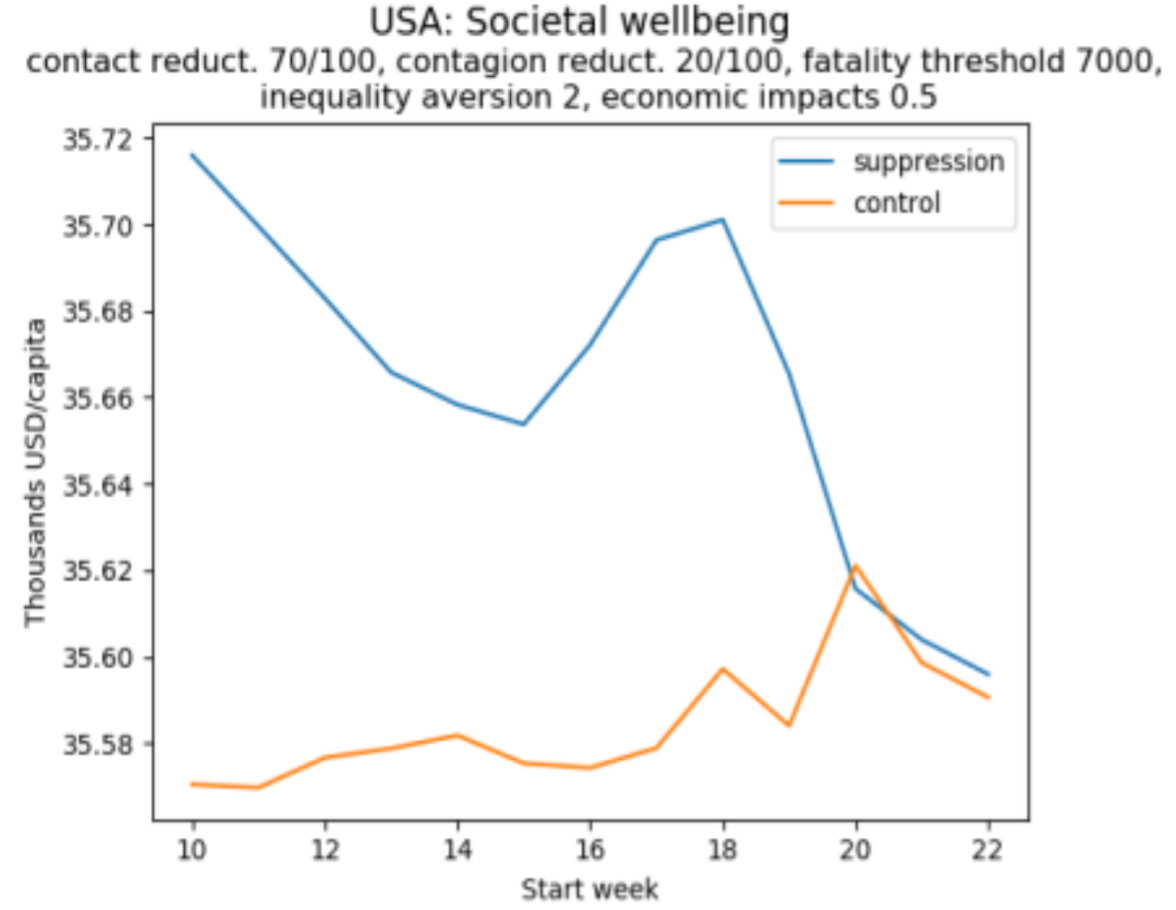
(b)
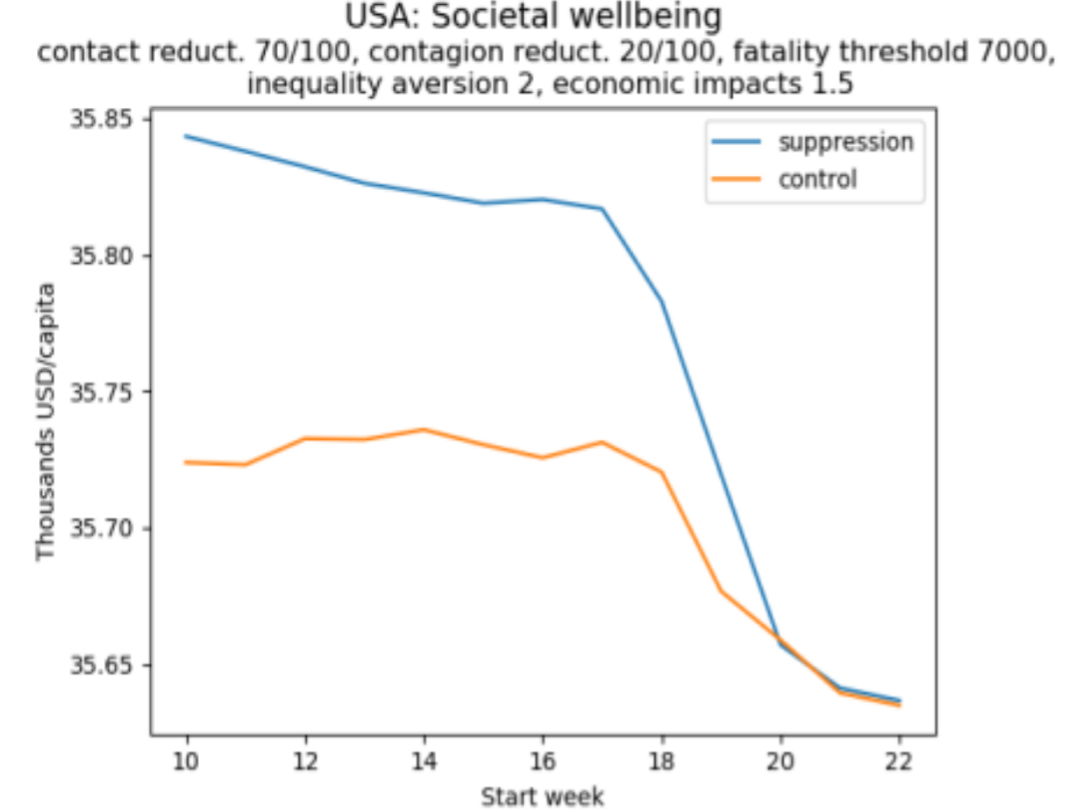
How to read these graphs: The vertical axis measures per capita equivalent income. As in Figure 2, the higher the better.
Figure 3a illustrates a situation in which lower income groups in the population bear a disproportionate economic burden, in the sense that the share of income lost declines as individuals get richer. If this burden is heavy, then late adoption of a suppression policy may be preferable to mid-term adoption. Late adoption of a control policy is preferable to any other time. In contrast, Figure 3b illustrates a situation in which there is a progressive distribution of the economic cost. Here, it is always the case that the earlier a policy is implemented, the better.
Although the current crisis presents a difficult trade-off between lives and livelihoods, it is possible to lay out the main considerations that should guide policy, including the key normative parameters for valuing health and economic outcomes and their distribution. Our modelling shows how the relevant empirical and normative elements of sound policy making can be put together into a rigorous framework. It also shows why the social welfare approach, which takes account of the distribution of all aspects of wellbeing and of background inequality, is superior to the benefit-cost approach. Moreover, although model results can at best provide only rough estimates of policy impacts, for reasonable parameters, it suggests that if redistribution mitigates the economic cost to the poorest, then it is likely that the earlier the virus is suppressed, the better.
This post represents the views of the authors and not those of the COVID-19 blog, nor LSE. It draws on a policy brief for the G20 policy and advice network, Think20. In an earlier post they explain the difference between cost-benefit and social welfare approaches.


