Following a disastrous attempt to assign pupil grades using a controversial algorithm, last year’s GCSE and A-level grades were eventually determined using Centre Assessed Grades. New evidence from a survey carried out by the UCL Centre for Education Policy and Equalising Opportunity (CEPEO) and the London School of Economics finds that some pupils appear to have benefited unfairly from this approach – particularly pupils with graduate parents. As teachers will again be deciding exam grades this year, this finding serves as an important warning of the challenges involved in ensuring that a system using teacher assessments is fair, say Jake Anders, Lindsey Macmillan (University College London), Patrick Sturgis (LSE), and Gill Wyness (UCL).
The decision to cancel formal exams in 2020 was taken at a late stage in the school year, meaning that there was little time for the government to develop a robust approach to assessment. After a short consultation, the Department for Education (DfE) decided that pupils’ exam grades would be determined by teacher’s assessment of pupils’ grades, including their ranking. However, to prevent grade inflation due to teachers’ over-predicting their pupils’ results, Ofqual applied an algorithm to the rankings to calculate final grades, based on the school’s historical results.
A-level pupils received their calculated grades on results day 2020, and although Ofqual reporting showed that the calculated grades were slightly higher than 2019 across the grade range, many pupils were devastated to find their teacher-assessed grades had been lowered by the algorithm. More than a third of pupils received lower calculated grades than their original teacher-assessed grades. Following a public outcry, the calculated grades were abandoned, and pupils were awarded the initial grades. This inevitably led to significant grade inflation compared to previous cohorts. It also created a unique situation where pupils received two sets of grades for their A levels – the calculated grades from the algorithm and the teacher allocated “centre assessed grades” or “CAGs”.
While it is now well established that CAGs were, on average, higher than the teacher predicted grades, less is known about the disparities between the two sets of grades for pupils from different backgrounds. Understanding these differences is important, since it sheds light on whether some pupils received a larger boost from the move to teacher-predicted CAGs, and hence to their future education and employment prospects. It is also, of course, relevant to this year’s grading process, as grades will again be allocated by teachers.
Administrative data on the differences between calculated grades and CAGs is not currently publicly available. However, findings from a new UKRI-funded survey of young people by the UCL Centre for Education Policy and Equalising Opportunity (CEPEO) and the London School of Economics (LSE) can help us to understand the issue. The survey provides representative data on over 4000 young people in England aged between 13 and 20, with interviews carried out online between November 2020 and January 2021.

Respondents affected by the A level exam cancellations (300 respondents) were asked whether their CAGs were higher or lower than their calculated grades. The resulting data reveal stark differences in the extent to which pupils were given a boost by the decision to revert to CAGs. As shown in Figure 1, pupils with graduate parents were 17 percentage points more likely to report that their CAGs were higher than their Ofqual calculated grades. The survey data are linked to administrative data on prior attainment at Key Stages 2 and 4, as well as demographic and background characteristics (such as free school meals status, ethnicity, SEN and English as an additional language). Even after accounting for differences between pupils across these characteristics, those with graduate parents were still 15 percentage points more likely to report having higher CAGs than calculated grades.
Figure 1. Proportion of young people reporting their CAGs were better than their calculated grades by whether or not they report that one of their parents has a university degree (left panel: raw difference; right panel: adjusted for demographic characteristics and prior attainment)
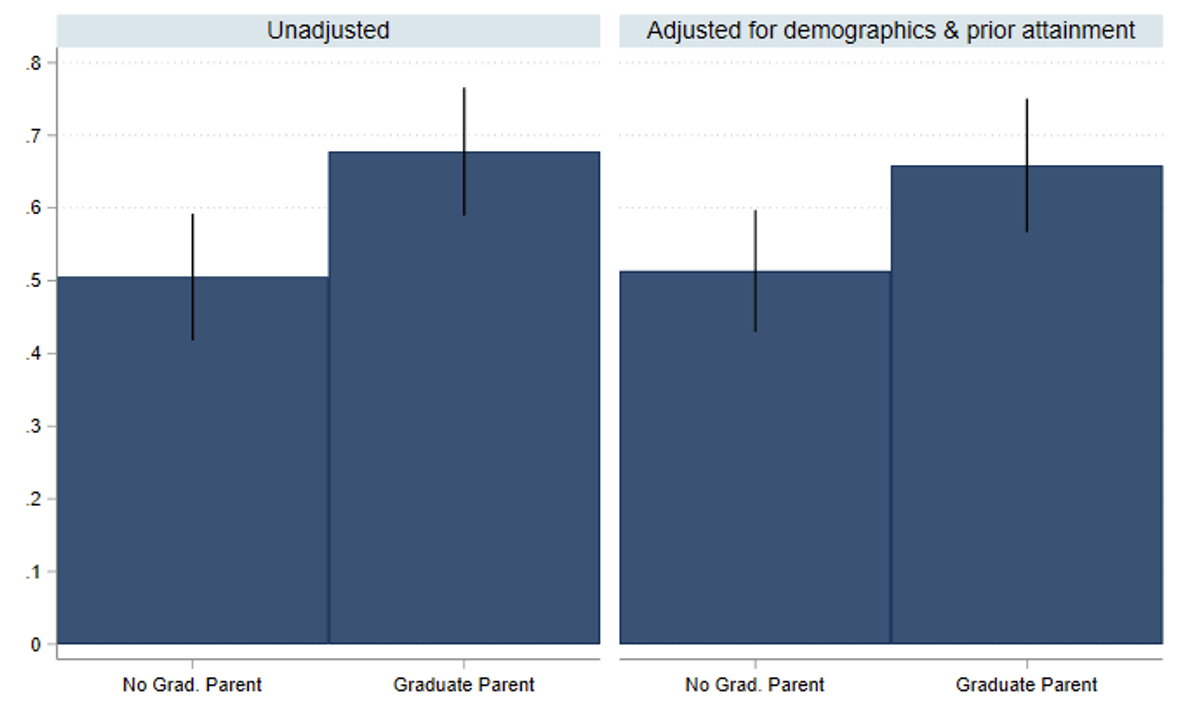
Weighted for non-response. Source: UCL CEPEO/ LSE COVID-19 survey 2020/21. Sample = 300
There are a number of possible explanations for these differences. First, it could be that pupils with graduate parents are more likely to attend particular types of schools that have a greater tendency to ‘over-assess’ grades. While not directly relevant to this sample, an extreme version of this are documented cases of independent schools deliberately over-assessing their pupils, but this could also happen in less dramatic and more unconscious ways. It could, for example, be more likely among schools that are used to predicting grades as part of the process for pupils applying to highly competitive university courses, where over-prediction may help more than it hurts.
A second possibility is that graduate parents are more likely to lobby their child’s school to ensure they receive favourable assessments. Such practices are reportedly becoming more common this year, with reports of “pointy elbowed” parents in affluent areas emailing teachers to attempt to influence their children’s GCSE and A-level grades ahead of teacher-assessed grades replacing exams this summer.
A third possibility is that the relatively high assessments enjoyed by those with graduate parents is a result of unconscious bias by teachers. A recent review by Ofqual found evidence of teacher biases in assessment, particularly against those from SEN and disadvantaged backgrounds, while a new study from Russia showed that teachers gave higher grades to pupils with more agreeable personalities. Interestingly, we found no differences between FSM and non-FSM pupils, perhaps suggesting teachers were careful not to treat FSM pupils differently. But they may nonetheless exhibit an unconscious positive bias towards pupils from backgrounds that tend to be associated with higher educational achievement.
Our results do not shed light on which of these explanations, if any, is correct. Regardless of what is behind this systematic difference, our findings show that pupils with more educated parents received an unfair advantage in their A-level results last year, with potential repercussions for equality and social mobility. They also highlight this is a substantial risk for this year’s process – perhaps even more so without the expectation of algorithmic moderation: grading pupils fairly in the absence of externally set and marked assessments is setting teachers an almost impossible task.
Learn more about our project on the impact of the pandemic on young people here.
Methodology
The UKRI COVID-19 funded UCL CEPEO / LSE survey records information from a sample of 4,255 respondents, a subset of the 6,409 respondents who consented to recontact as part of the Wellcome Trust Science Education Tracker (SET) 2019 survey. The SET study was commissioned by Wellcome with additional funding from the Department for Education (DfE), UKRI, and the Royal Society. The original sample was a random sample of state school pupils in England, drawn from the National Pupil Database (NPD) and Individualised Learner Record (ILR). To correct for potentially systematic patterns of respondent attrition, non-response weights were calculated and applied to all analyses, aligning the sample profile with that of the original survey and the profile of young people in England.
This work is funded as part of the UKRI COVID-19 project ES/V013017/1 “Assessing the impact of Covid-19 on young peoples’ learning, motivation, wellbeing, and aspirations using a representative probability panel”.
This work was produced using statistical data hosted by ONS. The use of ONS statistical data in this work does not imply the endorsement of the ONS in relation to the interpretation or analysis of the statistical data. This work uses research datasets which may not exactly reproduce National Statistics aggregates.
This post represents the views of the authors and not those of the COVID-19 blog, nor LSE.


1 Comments