In some cities, people are not travelling as far and as often as they did in the pre-COVID era. Philipp Rode (LSE) looks at the new patterns of movement and the challenges that will emerge as hyper-localisation becomes more common.
We think of cities as locations, specific places that allow for better access to people, jobs, education, goods and services. We also acknowledge that not everything in a city can be literally in one place and accept the need to travel between the opportunities individual cities provide. This demands a clear idea of what binds a city together. For long, economists have considered the functional urban areas, urban planners the built-up area, and geographers a combination of population size, density and political demarcations.
One cross-cutting idea is that of a collective territory that is accessed daily by its citizens. For work-related travel, this has led to the concept of commuter sheds — the territory from which a certain threshold level of the population travels to a city’s main activity area. Another proxy for what corresponds to ‘daily access’ could be based on the relatively constant travel time budget, also known as the Marchetti’s constant. This budget suggests that throughout history people spend about one hour per day travelling. Considering return journeys and depending on the speed of travel, this then translates to a territory ranging from a diameter of 2 km (walking) to 100 km (by high-speed rail).
But what happens when this foundational definition is confronted with citizens who no longer require or desire daily access? What if a joint territory for collective engagement is defined by weekly or even monthly travel? And what if more frequent accessibility emerges, requiring city access at much shorter intervals of just several hours on any given day? Simply put, if the frequency of accessing opportunities in cities is changing, the temporal geography of cities needs to be re-evaluated.
The disruptions associated with COVID-19 have amounted to a natural experiment. It generated much debate about the likely implications and outcomes on future urban structures, mobility and transport. While citizens were initially forced to reduce travel frequencies and distances as part of the various lockdowns, behaviour change post-lockdown is only now becoming clearer.
The Urban Age Debate on ‘Localising Transport: towards the 15 min city or 1 hour metropolis?’ polemically considered alternative temporal geographies of cities. One way of interpreting this question spatially concerns the changes in daily travel distances. City-wide average travel distances are a function of the time and speed of travel. Travel speeds for the same transport modes without new infrastructure and services usually do not change much over short periods. The changes in mobility over the last two years were mostly due to modal change such as walking instead of motorised modes, and a reduction in the time we spend travelling, such as reducing commuting times and changing trip frequencies.
The disruptions associated with COVID-19 have amounted to a natural experiment
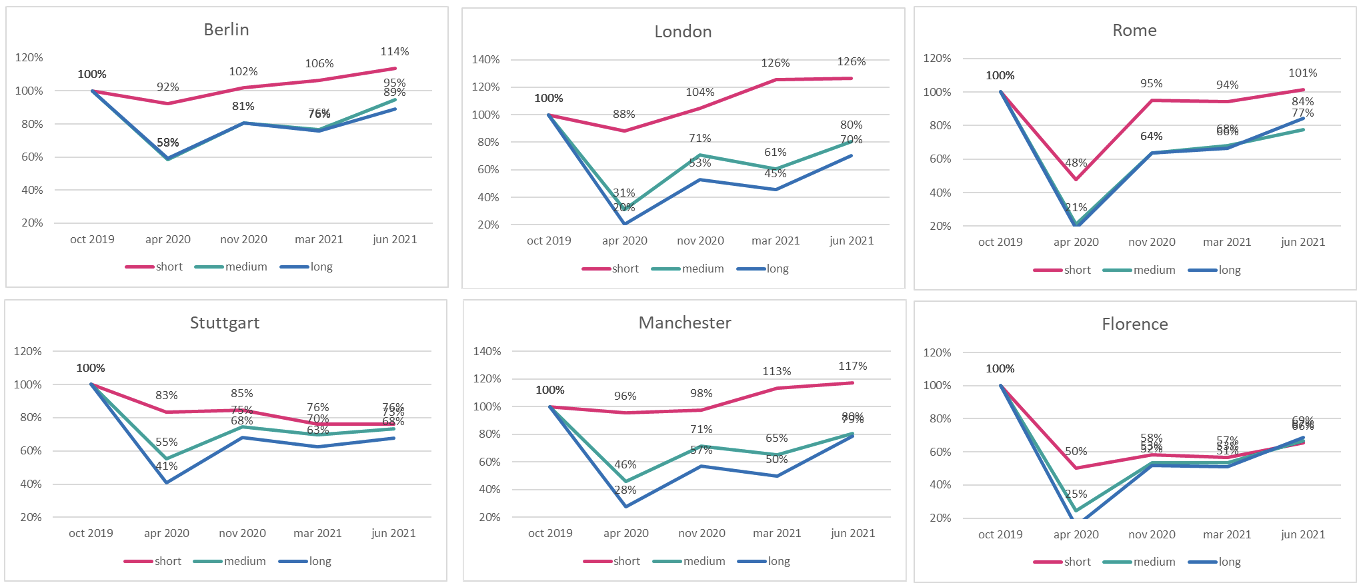
So what do we know about these changes? For a simple empirical analysis of daily travel distances, it is helpful to differentiate local trips that can easily rely on walking (below 2 km), city-level trips that require some mechanised transport (between 2 and 10 km) and regional-level trips relying on higher-speed motorised travel (above 10 km). The data below shows the changes observed in weekday travel before, during and after lockdown measures in six cities in Germany, the UK and Italy (in each case the largest and a prominent second tier city).
This information is based on anonymised mobile phone data cells and has been collected and prepared by Teralytics, a mobility data service provider and knowledge partner of the Urban Age Debate on city access. It considers all trips that either started or ended within the administrative boundaries of these cities. Teralytics data combine mobile network, road network and census data for extrapolation, which is validated via mobility partners. It considers the full population and all demographics. Importantly, observed changes relate not only to local residents but to tourists and visitors too. Five representative days were selected, the first in October 2019 and the last in June 2021.
All six cities saw a considerable reduction in medium-length and longer trips of between 55 per cent (Stuttgart) to 80 per cent (London) which has recovered in 2021, but not yet to pre-COVID levels. The patterns of short trips are more diverse, with Berlin, London and Manchester registering a considerable increase, particularly post lockdown (with increases of 14, 26 and 17 per cent respectively). Stuttgart and Florence registered a reduction in short trips which continued post lockdown, while Rome’s short distance travel is back to pre-COVID levels.
Figure 1: Changes of different trip length categories (short < 2 km, medium 2 to 10 km, and long > 10 km) in six European cities between 2019 and 2021 (one selected day for the indicated months).
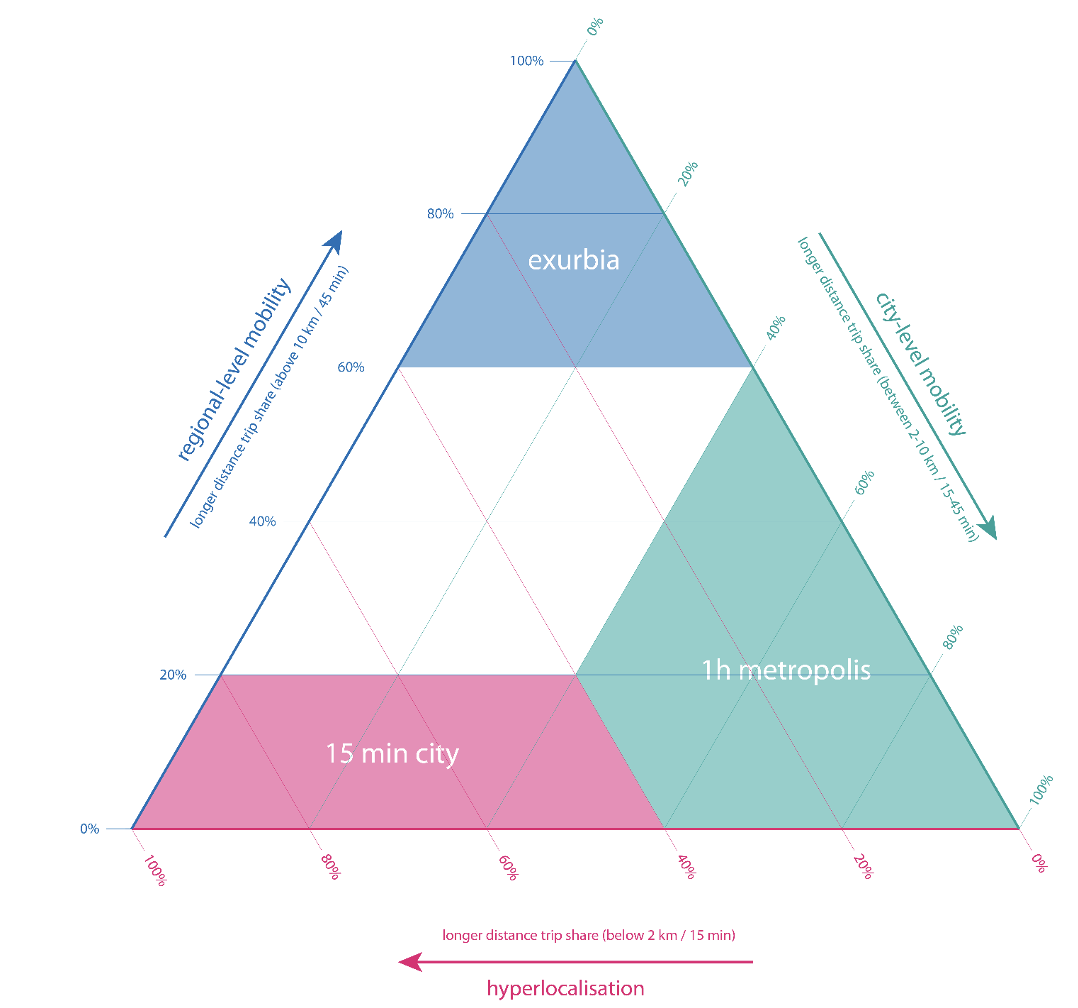
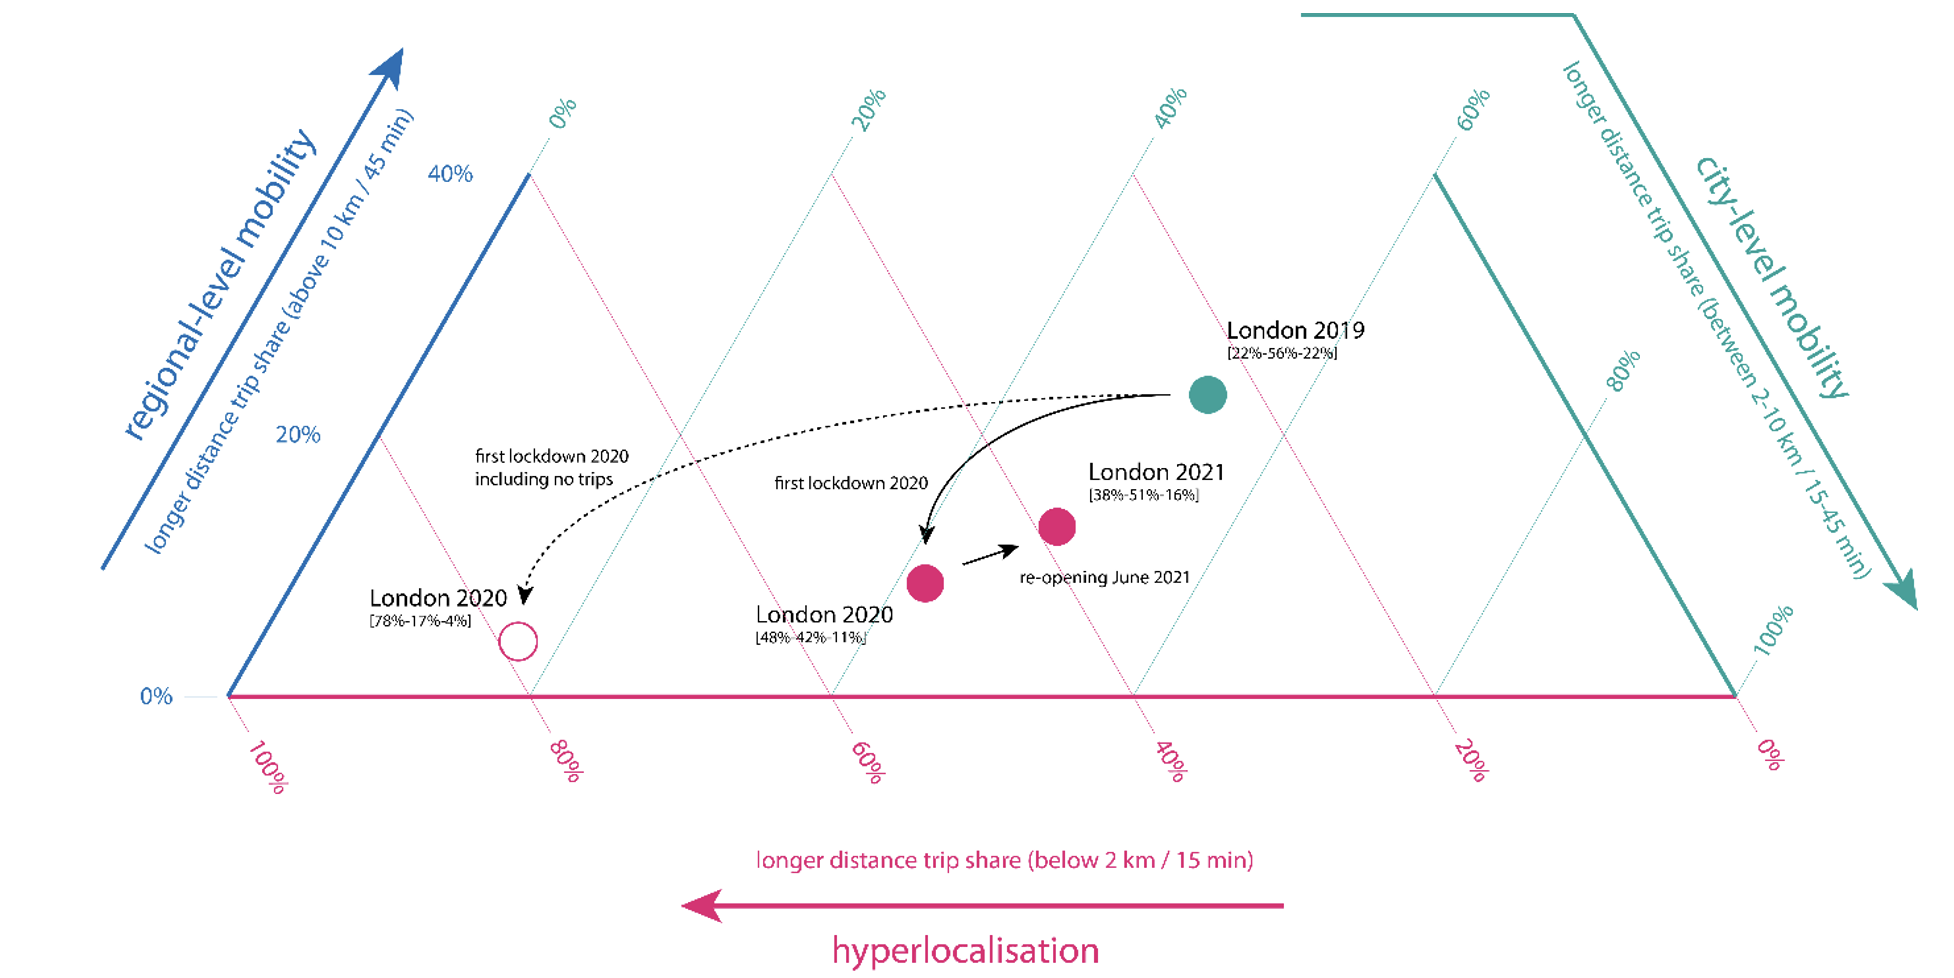
One approach for conceptualising the differences in urban mobility and trip distances involves the use of a ternary plot indicating the shares of local, city-level and regional trips (Figure 2). The shares of each are plotted in relation to the three axes of the diagram. The share of two always determines the third share to make up 100 per cent. On the horizontal, the share of local trips increases from right to left; on the left-side vertical, the regional-level trips increase, moving upwards; and on the right-side vertical, the city-level mobility increases, moving downwards.
The three corners of the triangle represent three theoretical urban architypes. Loosely, the bottom left represents 15-minute cities, with local trip shares of at least 40 per cent and regional-level mobility less than 20 per cent. The bottom right represents the one-hour metropolis, with medium-length trips making up at least 40 per cent of the total. Exurbia features in the top corner, with regional-level mobility (i.e. longer trips) of at least 60 per cent. None of these three architypes exclude any kind of trip length. Rather, they reflect different shares of trip lengths.
Figure 2: Ternary plot with travel distance shares and urban access architypes
This mobility ternary plot allows us to locate the patterns in individual cities and to observe changes over time and as a result of disruptions such as COVID. Empirical insights from European cities indicate that most urban regions operate within the lower part of the ternary plot, with longer-distance travel below 40 per cent of trip shares. Figures 3 and 4 contrast the overall position and changes in London and Stuttgart. Once again, the baseline data was extracted from mobile phone data based on Teralytics analysis.
In London, mobility patterns pre-COVID were solidly associated with a one-hour metropolitan region, with short, medium and longer distance trip shares of 22, 56 and 22 per cent respectively. The first 2020 lockdown changed this to 48, 42 and 11 per cent, artificially shifting London into the above 15-minute city archetype. Considering evaporated trips, or those that were no longer registered as they were too short for mobile phone data cell changes, we see an even more extreme pattern of hyper-localisation (78, 17 and 4 per cent). During the slow opening-up of London up to June 2021, trip shares slowly moved back in the direction of the original pattern, but only reached halfway.
Figure 3: London mobility ternary plot with trip length changes between 2019 and 2021
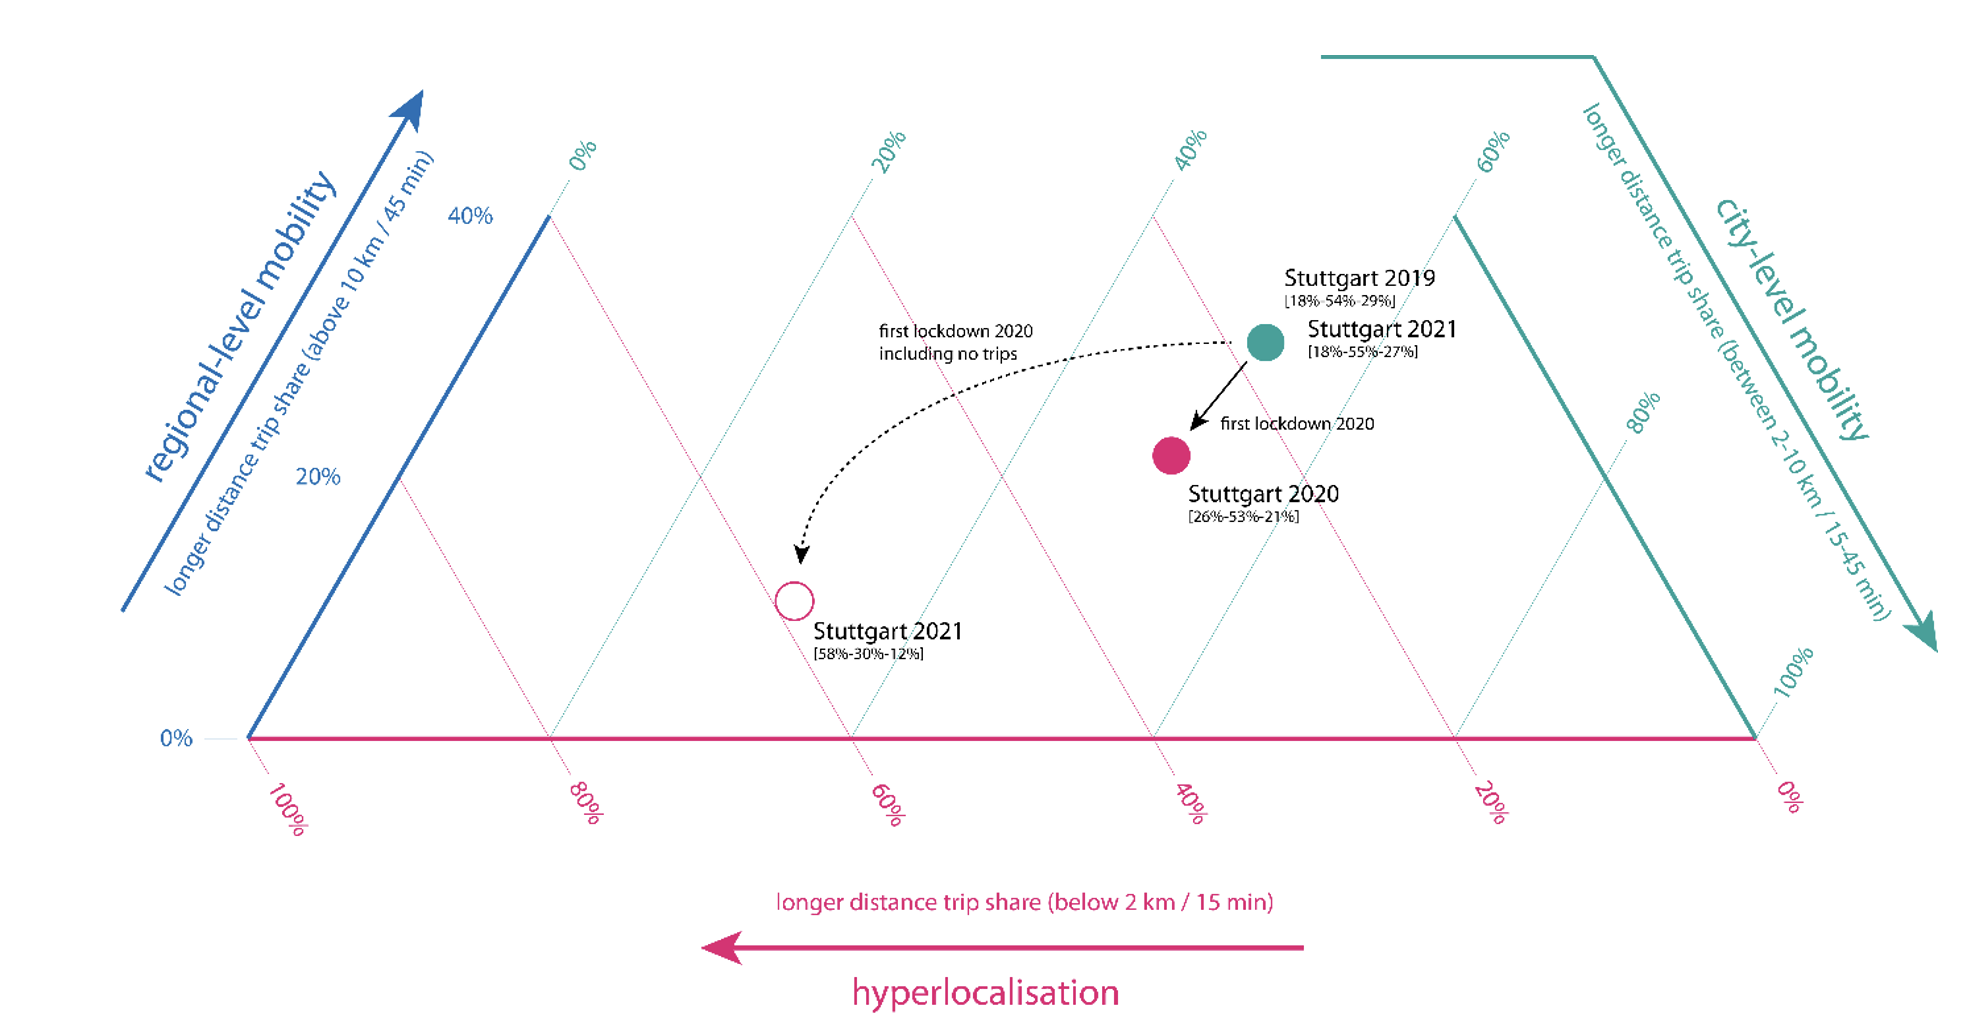
The pattern in Stuttgart, a German manufacturing hub, is quite different to the one in London. Stuttgart’s point of departure was also as a city-region with a higher share of longer distance trips. Starting with short, medium and longer-distance shares of 18, 54 and 29 per cent respectively, these shifted to 26, 53 and 21 per cent before returning to the 2019 pattern by June 2021.
Figure 4: Stuttgart mobility ternary plot with trip length changes between 2019 and 2021
This initial data and analysis leave invites many questions. To what extent are changes a result of the absence of visitors and tourists, rather than behaviour change by local residents? Was the identified hyper-localisation a consequence of everyone travelling less frequently at the metropolitan level, or just a few travelling city-wide on a daily basis? Which trip purposes were most affected by these changes? How do different cities present different patterns of trip changes? What are the key determinants that may contribute to hyper-localisation? Some of these questions will soon be addressed by follow-up research.
Most importantly, the data tells us little about what may happen next, though the recent Urban Age Debate Survey of urban experts and practitioners gave some hints. Two-thirds consider hyper-localisation in cities more likely than a further dispersal of urban settlements. According to well above 70 per cent of respondents, this will happen alongside an absolute increase in active travel (walking and cycling), a reduction in commuting and business travel, and an overall reduction in physical travel due to virtual connectivity. Most respondents also believe it is likely that the movement function of urban streets will be reduced, and their use as public space with more prominent place functions will increase.
Metropolitan-wide trips on a weekly or monthly basis rather than daily should not threaten the unit of a city
So, can cities be hyperlocal? A high share of voluntary local trips without city-wide access restrictions in terms of travel time, costs and other mobility service parameters may be quite desirable. Clearly, any constraints in accessing the wider city and having to stay local with limited local opportunities is socially and economically problematic. A high share of longer, regional trips – or hypermobility – may not be something a city-region wants to aspire to. These come with considerable personal costs, as research into long commutes has shown, and compromise environmental sustainability. For cities, hypermobility may also require compromising place functions of public space to enable excessive movement.
But how is the city kept together as a unit between the extremes of hyper-localisation and hypermobility? Clearly, it is not achieved by everyone travelling across the city’s territory all the time, which would destroy the city as a place to dwell in. Instead, a collective political, economic and cultural space alongside a strong geographic identity will have to remain the foundation. This certainly requires physical connection, but also urban districts that blend into each other without clear boundaries, as towns and villages have. Cities may operate surprisingly well as a calm lake with a shared temperature, rather than a whirlpool with all the elements in constant motion.
In other words, barriers to city-wide access should be eliminated, and fluid movement needs to be possible across a city’s entire territory. But conducting metropolitan-wide trips only on a weekly or monthly basis rather than daily should not threaten the unit of a city, as long as it prioritises efforts to establish fair and equal local opportunities across its whole area. It is these, alongside a reduction in the need to travel, that ultimately enable street life and thus urbanity.
This post represents the views of the author and not those of the COVID-19 blog, nor LSE.
Acknowledgements
The author would like to thank Georg Polzer, Jonas Karlsson, Maja Zupan and Ann Lin at Teralytics who enabled this Urban Age knowledge partnership and established the baseline data for the trip distance share analysis above. The Urban Age Debate series is organised by LSE Cities and the Alfred Herrhausen Society.