Photo by Domingo Abrusci
Covid-19 has presented a global health crisis of epic proportions and currently stands as the leading cause of death in the United States. To date it has killed nearly 2.5 million people worldwide, making it the 6th deadliest disease in the world. Unsurprisingly, there are giant discrepancies in who has been most impacted by the pandemic— with marginalized communities experiencing the majority of negative health and economic outcomes.
We’ve already lost over 28,000 New Yorkers to COVID-19. As this tragedy unfolded, my collaborators and I were struck by how the uneven impact of the virus laid bare the city’s systemic inequities. Illuminate Cities developed a public-facing art installation with the goal of exposing the discrepancies we saw, increasing awareness, fostering dialog and encouraging direct action to address the structures that contribute to them.
Illuminate Covid: 19 a project highlighting disparities
The installation, Illuminate: Covid – 19, took the form of a Video-LED lightbox in the shape of New York’s five boroughs and uses light intensity and color saturation to form data maps which help the viewer visualize COVID-19’s impact on different communities. The video sequence juxtaposes the COVID-19 infection and death rates of neighborhoods against maps showing the racial and economic demographics of the same areas. We focused on race and poverty because early data showed these to be the two factors most highly correlated with infection and mortality. It also allowed us to expose how long histories of institutionalized racism have cemented the correlation of negative health outcomes with both BIPOC (black, indigenous, and people of color) identity and low-income status. In the United States there is a longstanding negative correlation between wealth and BIPOC status, and the maps further show how the wealth gap experienced by people of color compounded the vulnerability of specific communities.
The most impacted neighborhoods were in the South Bronx (Morrisania, Motts Haven and Hunts Point), Eastern Queens (Rockaway, East Elmhurst, Corona and Flushing), in Brooklyn (East New York, Brownsville, and Bed Stuy), and Harlem and Morningside Heights in Manhattan. These areas remain heavily affected. These neighborhoods have high instances of poverty, with populations which are predominantly people of color. They have all also previously been identified by the City as underserved.
Racial and social inequality have long been the strongest determinants of who is affected by disease and its socioeconomic fallout. People of color are most at risk due to underlying conditions, environmental disparities and limited or no access to care. In the case of COVID-19, these same people are also most prone to occupational exposure, as they tend to work for an hourly wage as “frontline” or “essential” employees, where contagion is more likely – most commonly food service, hospitality or healthcare settings. They are more likely to commute to work by public transport where it is difficult to practice physical distancing. In New York City, 75% of all frontline workers are people of color. Black and Hispanic individuals had higher instances of COVID-19 due to pervasive social inequalities that increase their difficulty in implementing social distancing, remote work and other contact-minimizing tactics. Furthermore, Black patients were more likely than White patients to test positive for COVID-19, but if hospitalized they had lower mortality rates. This suggests that neighborhood and health access characteristics contribute to the higher overall mortality rate among Black individuals.
We conceived the installation as a way of bringing this information to the forefront and addressing a number of planning and justice issues: awareness, acknowledgement of individual and community experiences and access to information.
Art as a mouthpiece and awareness platform
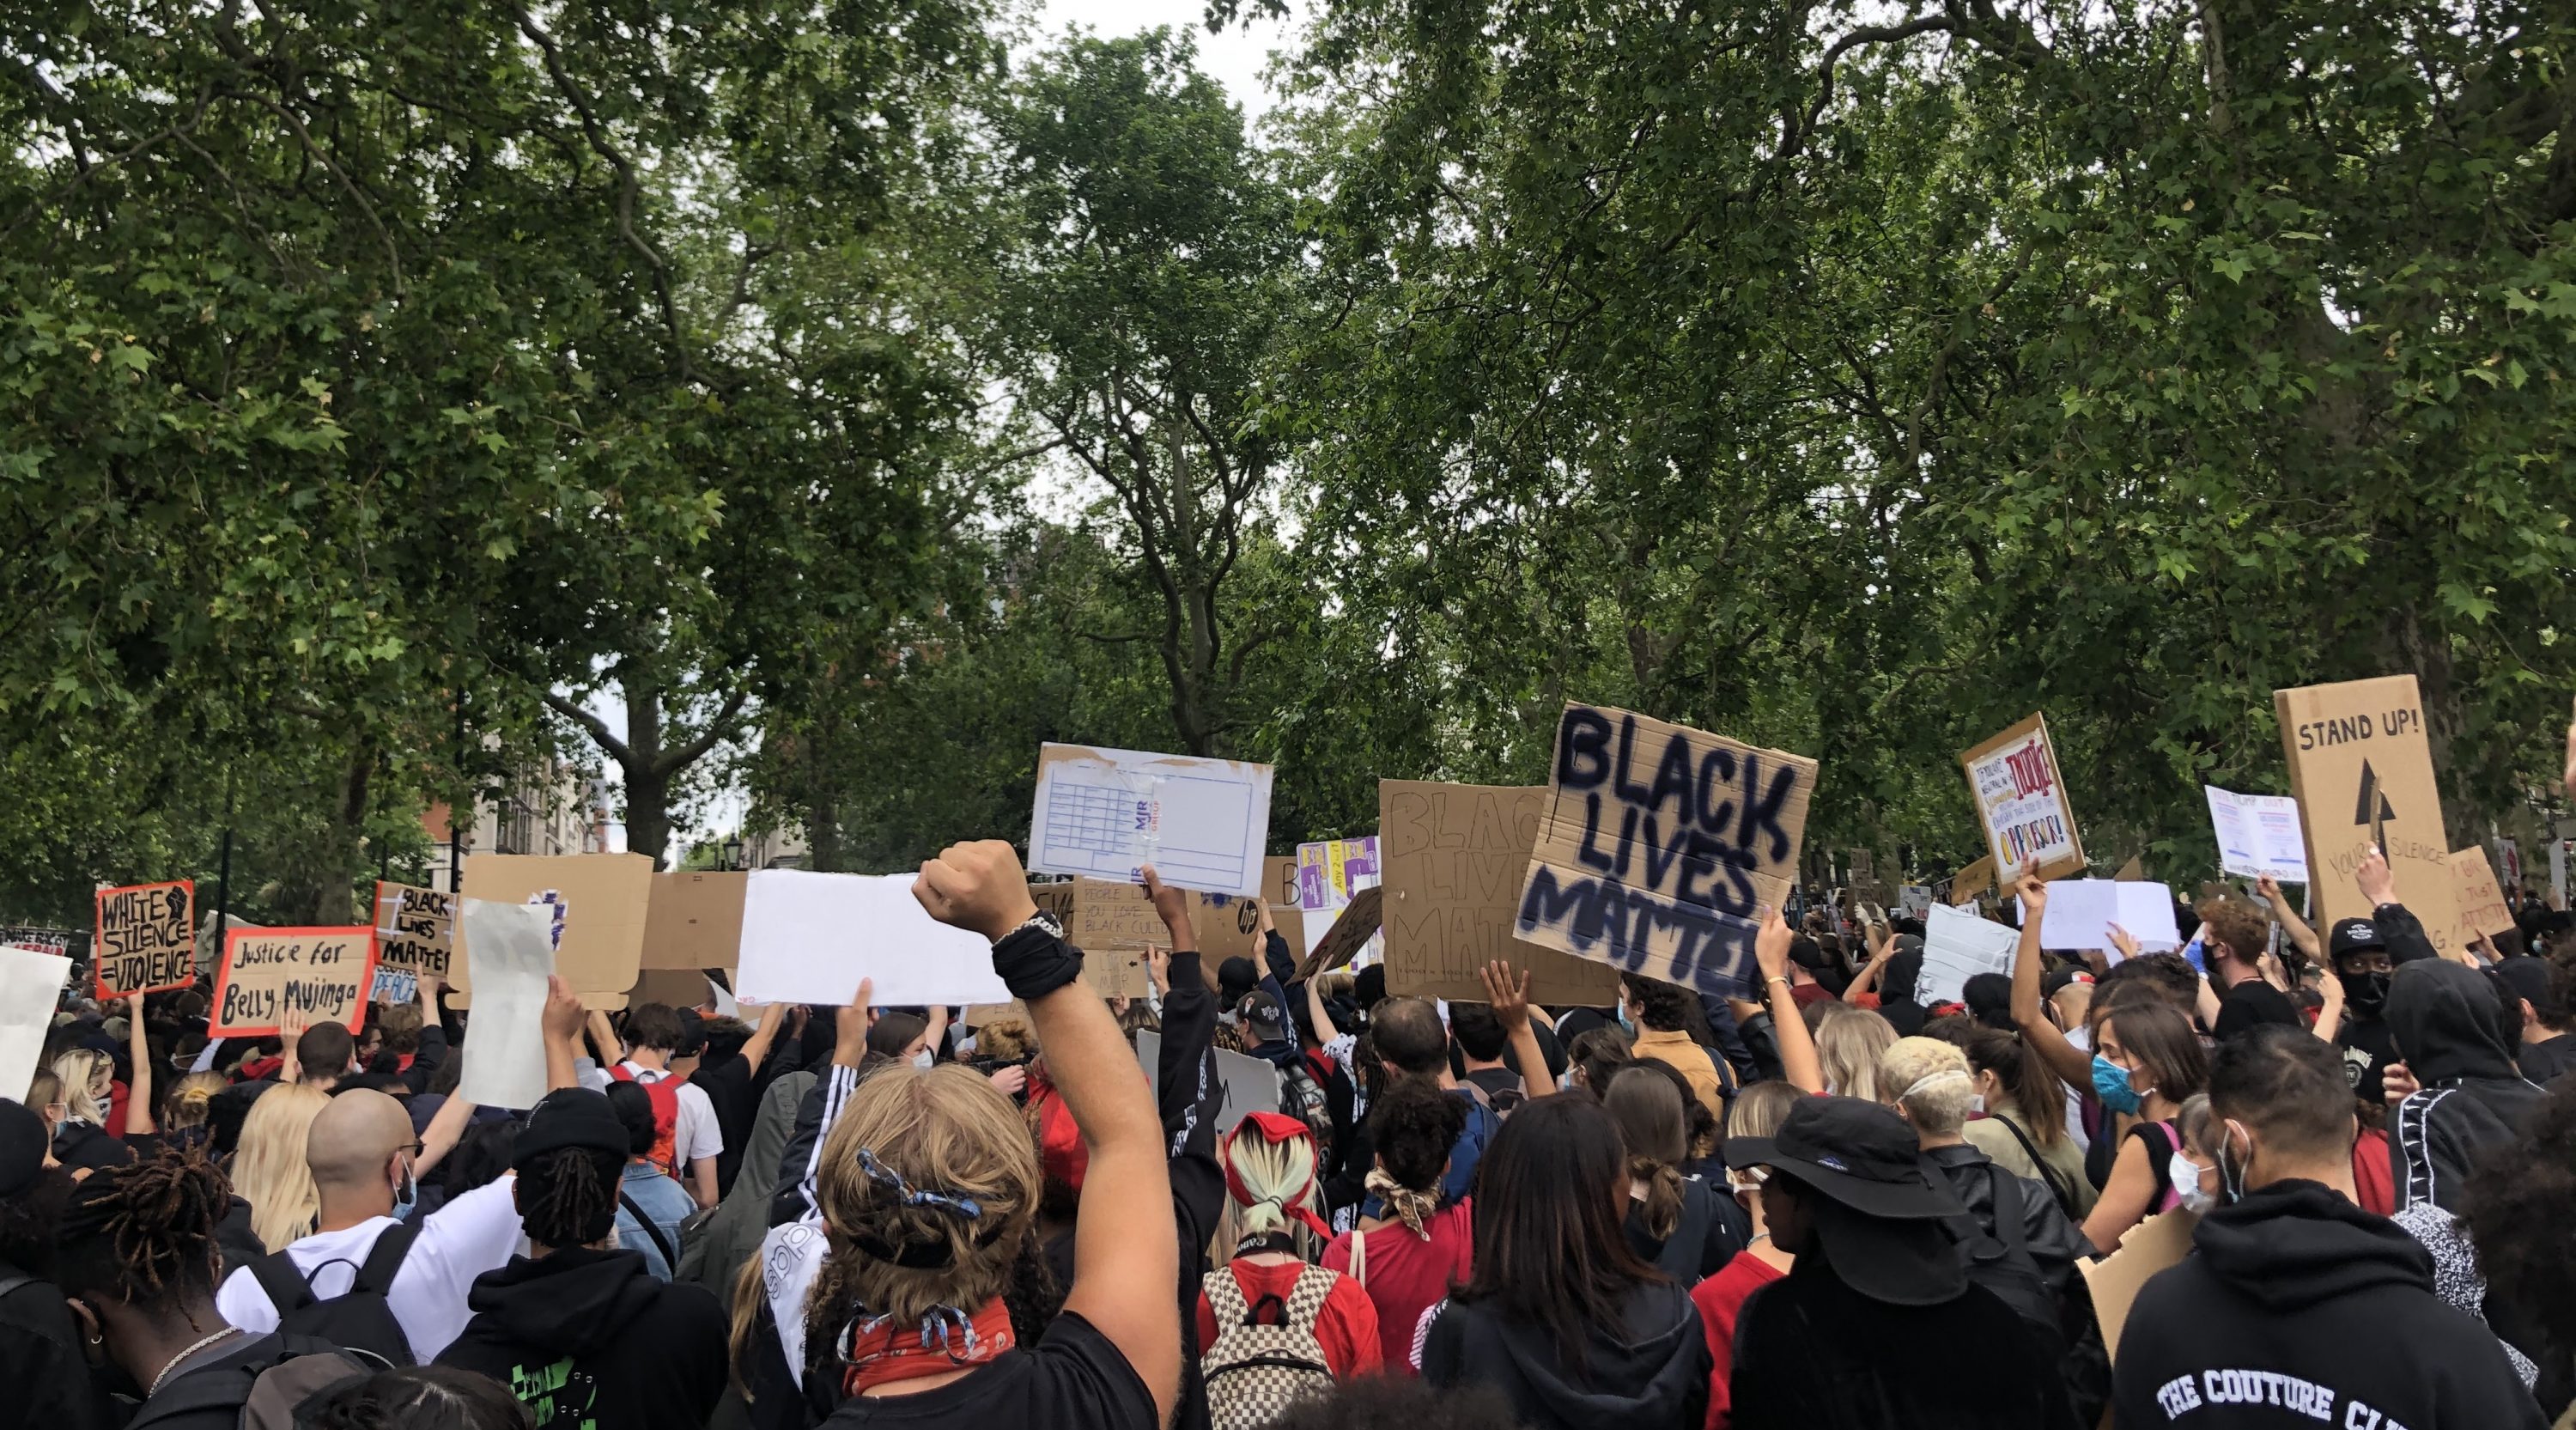
Racial disparities created a giant gap in the way people experienced the pandemic. The pandemic coincided with a summer of intense activism around Black Lives Matter – a movement dedicated to raising awareness for the immense disparities in personal safety, opportunities and health experienced by BIPOC communities. The installation built on this momentum by driving awareness about the disparities exposed and intensified by the pandemic. It prompted viewers to consider the underlying causes and what could be done to counter them. It advocated for the communities most in need of support and investment.
Memorializing + Reifying Experience
Unlike other global and national tragedies, pandemics are rarely memorialized. Individuals who personally experienced the virus – the sick and those devastated by deaths in their families and networks – deserve to have these experiences acknowledged and reified. Public recognition creates room for empowering individual and community-led dialog around experiences and has the potential to create inroads to trust and communication.
Illuminating Information: Data Access and the Digital Divide
Art and design provide unique opportunities to address issues of transparency around COVID-19 and to connect numbers with individual lives and communities. Public data should be accessible to the communities it describes and impacts. Accessibility is twofold: clarity and ease of comprehension of information, and the capacity to find and access it.
NYC and many major cities have high incidences of digital inequity, a lack of tech access to the digital sphere by vulnerable communities. The majority of COVID-19 related city and state government communication, as well as the interactive platforms created by news and research agencies, required the internet or digital tools to access. In this way, the digital divide intensified health disparities, cutting off vulnerable individuals from both information that could have assisted them in resisting the virus and about how the pandemic was already affecting them.
Data also remains largely obstructed from the public due to legibility issues, tied to the capacity and bandwidth of ordinary citizens to interpret and engage with it. Outside of planning circles it is rare to review and compare data sets and mappings. Not only is this information largely inaccessible in terms of its discovery, but it is largely presented in ways that are incomprehensible to those outside expert circles. By using art as a tool of visual translation, we hoped to highlight correlations and activate data in a way that was easily understandable and didn’t require unearthing and sorting through government websites or deep understanding of statistical calculations and concepts.
In addressing the form in which data is presented, we also hoped to counter the ways in which mapping has been used to blame communities for the problems that affect them. Instead we hoped Illuminate: COVID-19 would encourage the more recent planning practice of using maps to engage local populations in their own visioning, helping them visualize, identify and resolve local issues.
COVID-19 Legacy and Vaccine
Illuminate Cities plans to continue to adapt the exhibit to follow the trajectory of the virus, and to include vaccination rates and related information as they become available and reliable. There is an immediate need to address structural issues to avoid poorly managed vaccination rollouts from further intensifying the health and economic disparities exposed by the installation. COVID-19 has decreased life expectancy at intensified rates for BIPOC and increased the wealth gap for those same communities. Evidence already suggests that BIPOC communities are getting vaccinated at significantly lower rates, despite equity efforts. This is not surprising since vaccination access and information are dependent on the existing system of structural inequalities. NYC needs to address these issues with a specific eye to communication, transparency, and local engagement. As planners, it is imperative that we recognize our role in shaping policy, urban structure and programming. It is crucial that these interventions be centered on justice in order to disrupt racial inequity and its related health disparities.
The installation is currently moving around NYC to various locations on a semi-monthly basis. We’re excited to announce our March exhibition in partnership with the offices of Assemblyman Harvey Epstein at their space in the Loisaida neighborhood of Manhattan.
Illuminate Cities Project
The installation is currently on view in the offices of Assemblyman Harvey Epstein in the East Village (details below) and will be moving to various NYC locations on a semi-monthly basis.
- Office of State Assembly – District 74
- 107 Avenue B (Storefront), New York, NY 10009
- March 1 – April 12, 2021
- Light sequence operates from 10am to 11 pm
Illuminate Cities Project is a collaboration between a team of socially minded urban planners and architects, dedicated to improving cities through art, design and engagement. The goal of our collaborations is to use data in creative ways to explore, understand, envision and create more resilient cities.
- Alexandra Payne: Project Manager, Urban Planner and Policy Specialist (Amplify Studio)
- Domingo Abrusci: Project Lead, Designer and Architect (licensed in Italy)
- Elisa Forlini: Lighting Design, Chartered RIBA Architect
- Robyn Squires: Fabrication Specialist and Graphic Design (RYSQ LLC)


2 Comments