 Scandals have become a recurring feature of modern political life, but do they inevitably spell electoral doom for senators and representatives? Looking at data from 171 scandals from 1990 to 2010, Scott Basinger finds that scandal-tainted members of Congress are more than twice as likely to be defeated in general elections as the scandal-free. Scandals also mean much narrower election victories for incumbents when they do win elections. Overall, only two-thirds of representatives and barely two-fifths of senators survive their scandals because of election losses, retirement or resignation.
Political scandals provide an ideal setting for examining whether elections address a basic problem of representative democracy: ensuring that self-interested elected officials pursue the public interest. The principal mechanism for ensuring representation is the reelection incentive, but public ignorance potentially undermines accountability. Scholars have devoted great effort to a complex problem of discerning whether voters punish representatives for voting divergently from their district’s interests. I recently looked at the relatively simpler problem of assessing the electorate’s response to scandals involving members of Congress.
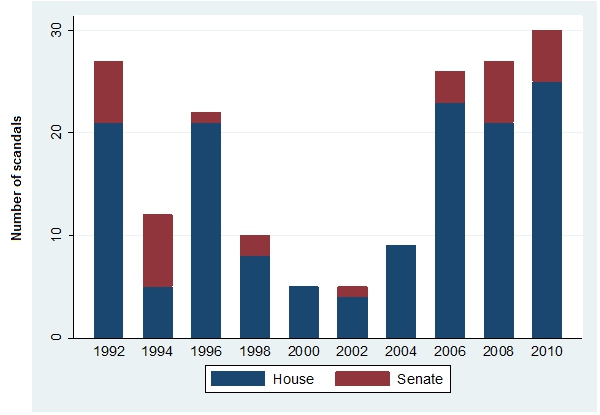
Before scandals’ electoral impact can be assessed, one must know how often scandals occur. In a research project sponsored by the Dirksen Congressional Center, I assembled lists of scandals involving the members of the U.S. House of Representatives and U.S. Senate. Between 1990 and 2010, representatives were involved in 142 scandals, and senators were involved in 31 scandals. Combined, this amounts to nearly 9 scandals per year and 17 per election cycle. In some election cycles, dozens of members may be involved in a single scandal, as occurred in 1991-2 (the House Bank) and 2005-6 (Abramoff). Figure 1 shows the frequency of scandals per election, combining representatives and senators.
Figure 1 – Scandals per election cycle, 1992-2010
Scandal, as I use the term, covers a wide range of alleged misdeeds. Corruption and financial misfeasance account for more than half of the scandals in my database. Although sex scandals often cause media frenzies, they account for just under one-fifth of scandals. Misuses of political power, a category that includes campaign finance improprieties, misuse of congressional offices, and vote fraud, also account for just under one-fifth of scandals. A residual category that includes driving under the influence of drugs or alcohol, assault, trespassing, and so forth, accounts for one-tenth of scandals.
To assess the magnitude of scandals’ electoral impact, I looked at how the incumbent’s margin of victory changes from the election before a scandal to the election after the scandal. For example, in 2002, Steve La Tourette, Republican from Ohio’s newly drawn 14th district, defeated his Democratic challenger 72 percent to 24 percent, yielding a margin of victory of 48. In 2003, it was revealed that La Tourette’s was estranged from his wife, the result of an extramarital affair with his chief-of-staff. Lest one think that this is a private matter between spouses, the former Mrs. La Tourette spoke openly to the newspaper and took the extraordinary step of placing campaign signs for the Democratic candidate in her front yard. In the 2004 election, La Tourette won re-election, but claimed only 63 percent of the vote against 37 percent for the Democrat, yielding a margin of victory of 26. The change in La Tourette’s margin of victory was -22.
For brevity, let me call this quantity delta. For House incumbents who were involved in a scandal, their average delta is -4.3 (with a standard deviation of 19.2). By contrast, House incumbents who were not involved in a scandal have an average delta of +1.7 (with a standard deviation of 15.7). To summarize, scandal-tainted House incumbents’ margins of victory are, on average, 6 points less than they would have been had they avoided scandal.
Figure 2 provides two histograms, showing the distributions of deltas for both scandal-tainted incumbents (Figure 2) and scandal-free incumbents (Figure 3). The number of scandal-tainted House incumbents for whom we could compute delta is relatively small, due to retirements, resignations, uncontested elections before the scandal broke, etc., so the distribution appears less smooth than that of scandal-free incumbents.
Figure 2 – Change in victory margin for scandal-tainted incumbent representatives, 1992-2010
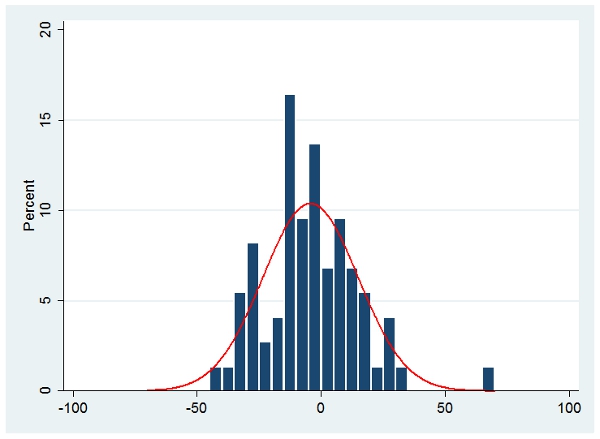
Figure 3 – Change in victory margin for scandal-free incumbent representatives, 1992-2010
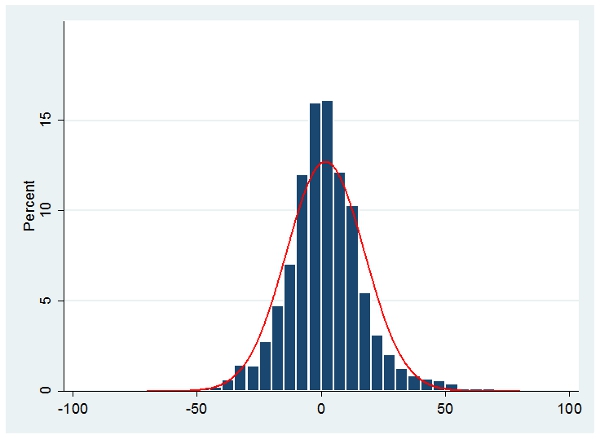
Alternative methods of analysis confirm that scandals have electoral impact. The median delta is -4.4 for scandal-tainted incumbents versus +1.0 for scandal-free incumbents. Additionally, 63 percent of scandal-tainted incumbents had a negative delta, compared to 46 percent of scandal-free incumbents.
Turning our attention to senators, the sample size is far smaller, but the apparent electoral effects are even larger. For scandal-tainted incumbent senators, their average delta is -8.6 (with a standard deviation of 9.1), while scandal-free incumbent senators’ average delta is +1.9 (with a standard deviation of 10.3). On average, scandal-tainted Senate incumbents’ margins of victory are 10.5 points less than they would have been had they avoided scandal.
Scandals’ effects on electoral margins translate directly into general election outcomes. Table 1 shows the average vote margin (vote share for the incumbent minus vote share for the challenger) and the proportion of general election defeats for House and Senate incumbents. In general, scandal-tainted members of Congress are more than twice as likely to be defeated in general elections as scandal-free members of Congress (although senators begin in a more precarious situation).
Table 1 – Scandals and general election outcomes, House and Senate, 1992-2010
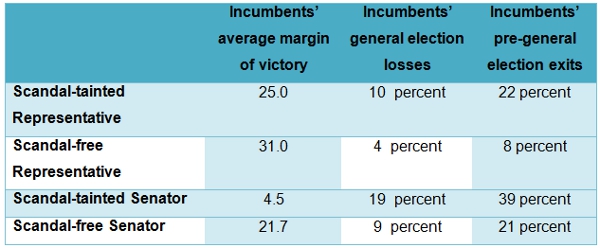
Table 1 also shows that scandal-tainted incumbents are more likely to exit Congress before the general election. Overall, when voluntary exits, primary election defeats, and general election defeats are combined, just 67 percent of scandal-tainted representatives and 42 percent of scandal-tainted senators survived their scandal through one election cycle. Scandal-free representatives and senators sought and won re-election 88 percent and 70 percent of the time, respectively. Put another way, 33 percent of scandal-tainted representatives and 58 percent of scandal-tainted senators do not win another election to their chamber after a scandal breaks.
On the surface, it would seem that we owe the voters credit for ejecting members of Congress who have been involved in scandals. However, conventional wisdom among congressional elections scholars holds that the candidates who bravely challenge incumbents deserve some share of the credit, particularly when these challengers are “experienced” – i.e., occupants of state and local elective offices. This view, which could be called the strategic entry thesis, receives no support in my analysis. Figure 4 shows that scandal-free and scandal-tainted incumbents in the House are equally likely to face experienced challengers (roughly 16 percent). Although senators are far more likely to face experienced challengers (roughly 40 percent), the likelihood hardly differs between the scandal-free and scandal-tainted. Instead, the main difference between scandal-free and scandal-tainted incumbents in each chamber is that scandals greatly increase the likelihood that the incumbent exits (i.e., retires, resigns, or loses the primary) prior to the general election.
Figure 4 – Scandals and general election contexts for incumbents in House and Senate
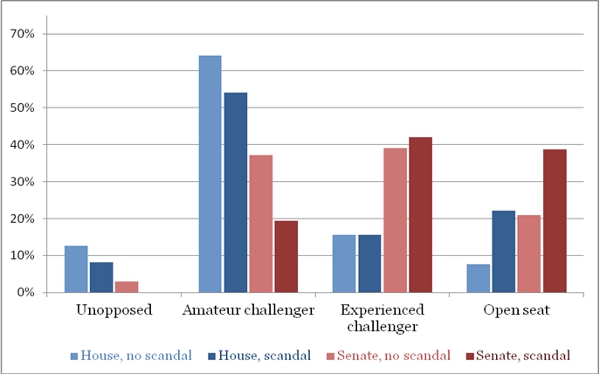
Note: Bar height indicates percent of incumbents in each category.
Source: Reprinted from “The Electoral Effects of Congressional Scandals
Figure 5 examines the frequency at which incumbents (or the candidate belonging to the incumbents’ party, in the case of open seats) won the election depending on the general election context. By examining adjacent blue columns (representatives) or adjacent red columns (senators), one observes that scandal-tainted incumbents lost more often than scandal-free incumbents, particularly when they faced experienced challengers.
Figure 5 – Election victories and scandals in the House and Senate
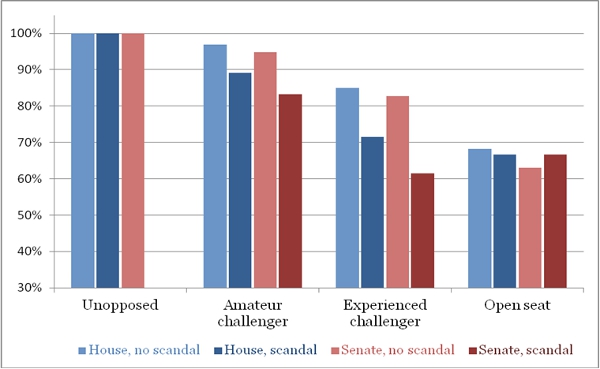
Note: Bar height indicates percent of incumbent-party candidates winning election.
Source: Reprinted from “The Electoral Effects of Congressional Scandals
The implication of this research is that members of Congress who misbehave can expect retribution at the polls, assuming they make it that far. Comparing general election loss rates to pre-general election exit rates, one can observe that members are more than twice as likely to exit, whether voluntarily (through retirement and resignation) or involuntarily (through primary election defeat), as to lose. And, although the data on scandals’ frequency indicate that misconduct is becoming more prevalent or receiving more publicity, the revelation that only two-thirds of representatives and barely two-fifths of senators survived their scandals suggests that ethics matters to voters.
Please read our comments policy before commenting.
Note: This article gives the views of the authors, and not the position of USApp– American Politics and Policy, nor of the London School of Economics.
Shortened URL for this post: http://bit.ly/1dGw1mK
_________________________________
About the author
 Scott Basinger – University of Houston
Scott Basinger is an Associate Professor of Political Science at the University of Houston. His research interests include the scientific study of politics, game theory and American politics.


