
 The way that the public responds to changes in monetary policy can be integral to whether such changes are successful. But how much do people really understand monetary policy? Using data from consumer surveys and inflation, interest rate and unemployment data, Carlos Carvalho and Fernanda Nechio find evidence that households do form expectations in a way that is consistent with the conduct of monetary policy. They also write that this evidence is more pronounced for households that have higher incomes.
“Improving the public’s understanding of the central bank’s policy strategy reduces economic and financial uncertainty and helps households and firms make more-informed decisions. Moreover, clarity about goals and strategies can help anchor the public’s longer-term inflation expectations more firmly and thereby bolsters the central bank’s ability to respond forcefully to adverse shocks.” – Chairman of the Federal Reserve Ben Bernanke in 2010.
Central bankers often emphasize the need to communicate with the public to improve their understanding of monetary policy. As the argument goes, this should allow households and firms to make better informed price- and wage-setting decisions, and improve policy effectiveness. More generally, agents’ understanding of how policies that affect their decisions are conducted is perceived to be a key ingredient in the policy transmission mechanism. This perception is guided by economic theories in which the behavior of the economy depends on the interaction between the actual conduct of policy and agents’ understanding of it.
In recent research we take a step back from the literature on central bank communication, expectations formation, and monetary policy effectiveness, and try to answer the more basic question of whether economic agents, U.S. households in particular, understand how the U.S. Federal Reserve (the ‘Fed’) conducts monetary policy. We find that households seem to have some understanding of monetary policy, especially at times when it is worthwhile for them to do so.
We addressed the question of interest by combining households’ answers to survey questions about the direction of changes of future inflation, unemployment, and interest rates from the Survey of Consumers (“Michigan Survey”). Here we illustrate our findings using simple regression analysis.
We begin by supposing that the Fed’s target for the federal funds rate depends positively on contemporaneous inflation and negatively on contemporaneous unemployment, and changes only with these two variables. These are principles consistent with the so-called Taylor rule. Then, to be consistent with these relationships, survey answers that indicate that unemployment will go down and inflation will go up in one year should, more often than not, be accompanied by an answer that the Fed will tighten monetary policy over the same period.
We compare our findings with results obtained using actual interest-rate, inflation, and unemployment data. To that end, we use monthly data on the 3-month Treasury bill rate, 12-month CPI inflation, and the unemployment rate to build categorical variables indicating whether each of them moved up, down, or remained constant over each 12-month period.
The sample period for our analysis starts in August 1987 and ends in December 2007. The starting point coincides with the beginning of Alan Greenspan’s tenure as chairman of the Federal Reserve Board, during which the Taylor rule came to be seen as a good description of U.S. monetary policy. The sample ends in December 2007 because the questions from the Michigan Survey pertain to 12-month forecasts, and at the end of 2008 short-term interest rates in the U.S. had essentially dropped to zero.
Table 1 shows our first set of results. It presents the OLS-estimated coefficients for the categorized realized data on inflation, unemployment, and interest rates, and for the Michigan Survey. The Michigan Survey data are split between households at the lowest and highest income quartiles (results by education levels yield analogous patterns, with lower education households resembling those at the lowest income quartile and higher education households resembling higher income ones).
Table 1 – Regressions for realized data and Michigan Survey by income
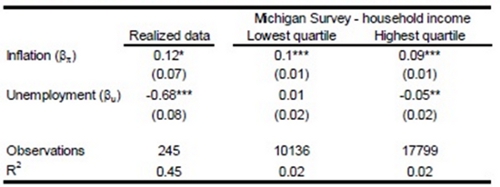
Focusing first on the realized data, the first column shows that the expected pattern is verified; changes in interest rates correlate positively with inflation and negatively with unemployment. The Michigan Survey data show a strong positive relationship between answers regarding inflation and interest rates for both income groups. The unemployment coefficient, however, is only negative for higher income households.
These findings suggest that higher income households seem to perceive the patterns found in the data, and show that while the relationship between interest rates and inflation in the Michigan Survey answers is positive, irrespective of the demographics, the negative relationship between interest rates and unemployment is weaker.
One may ask if our regression results uncover the Fisher equation – a positive relationship between nominal interest rates and expected inflation – rather than a monetary policy rule. To investigate this possibility, we focus on higher income households, and estimate our regression pooling households by the year of interview. In particular, we are interested in exploiting the mid-2000s, during which Fed policy arguably deviated from a Taylor rule, keeping interest rates low and communicating that they would be in place for a “considerable period.” If what households have in mind when answering the Michigan Survey is the Fisher equation, then the pattern of their answers should not change during such a period. Instead, if household answers reflect their perceptions on monetary policy, one should expect to see changes in households’ responses.
The top panel of Figure 1 shows the estimated coefficients for inflation, along with their 95% confidence bands, and the realized inflation rate (dashed, right axis). The bottom panel of Figure 1 reports the estimated coefficients of unemployment, 95% confidence bands and realized unemployment gap (dashed, right axis).
Figure 1 – Regressions by year – Households at the highest income quartile
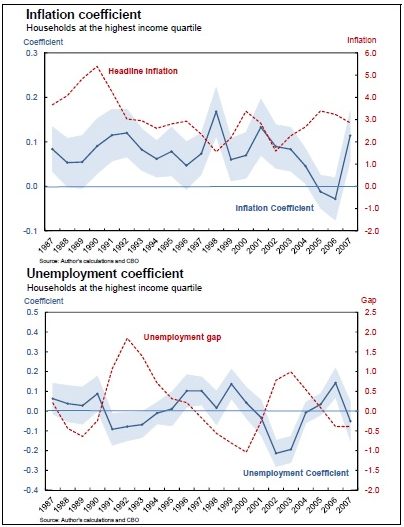
Consistent with the idea that these households’ responses reflect their perceptions of monetary policy, the inflation coefficients estimated year by year show that the strong positive relation holds for most of the sample, except during the mid-2000s, when it falls substantially and becomes statistically insignificant. The estimated unemployment coefficients also yield an interesting pattern, showing that answers vary systematically over the business cycle. The negative relationship between interest rates and unemployment is much stronger and statistically significant during periods of labor market weakness.
Do these results mean that households understand the basic features of U.S. monetary policy? How can we make sense of the statistical significance in our results, the degree of business cycle variation in the unemployment coefficient, and the change in the inflation coefficient during the mid-2000s? Maybe households are “empiricists” and simply repeat patterns they observe in their own experiences. In that case they might end up responding as if they understand monetary policy. The other possibility is that at least some groups of households do understand monetary policy, but may be inattentive and only think about monetary policy at times when doing so may be worth its while, or at times when monetary policy is relatively more salient. These might be times in which the labor market is weak, and unemployment makes the headlines.
Irrespective of the drivers of the business cycle variation in the pattern of responses, we can conclude that households’ beliefs about the evolution of inflation, unemployment, and interest rates – as elicited by the Michigan Survey – are related as if they had some understanding of U.S. monetary policy, particularly for the higher income (and more educated) households.
This article is based on the paper “Do People Understand Monetary Policy?,” forthcoming at the Journal of Monetary Economics, and has also appeared at Vox.LACEA.
Please read our comments policy before commenting.
Note: This article gives the views of the authors, and not the position of USApp– American Politics and Policy, nor of the London School of Economic or the Federal Reserve Bank of San Francisco or the Federal Reserve System.
Shortened URL for this post: http://bit.ly/1lTDqUr
_________________________________
Carlos Carvalho – Pontifical Catholic University of Rio de Janeiro
Carlos Carvalho is an Associate Professor, Department of Economics at PUC-Rio and partner of Kyros Investments. He has published articles in such areas as Macroeconomics, Monetary Economics, Finance, and Macroeconomics and International Finance. He was an economist and senior economist at the Federal Reserve Bank of New York from August 2007 to May 2011.
_
Fernanda Nechio – Federal Reserve Bank of San Francisco
Fernanda Nechio has been an economist at the Federal Reserve Bank of San Francisco since July 2009. She has published articles in such areas as International Macroeconomics and Finance, Macroeconomics, and Monetary Economics.