 The Great Recession of 2007-2009 meant a large hit to the revenues of U.S. states. Now, more than five years later, revenues in most of these states have recovered. But what has fuelled this recovery? Using data from across all 50 states, James Alm and David L. Sjoquist find that internal factors – such as the state’s economy, taxes, demographics, politics and policy – have had little or no effect on its revenue recovery. They argue that their results show that trends in state government revenues are largely influenced by broader, national, economic trends beyond the control of state governments.
The “Great Recession” lasted from December 2007 to June 2009, and wreaked havoc on the revenues of state (and local) governments. While the U.S. economy has improved since the end of the Great Recession, state government revenues have in most cases still not completely recovered. We use various indicators to measure how different states have – or have not – recovered in the aftermath of the Great Recession, and we also attempt to explain why these different patterns of recovery have emerged. Overall, we find that some, but far from all, state governments have recovered the revenue they lost during the Great Recession. We also find that there is no single causal explanation for recovery that applies to all state governments.
State Trends in Revenue Recovery
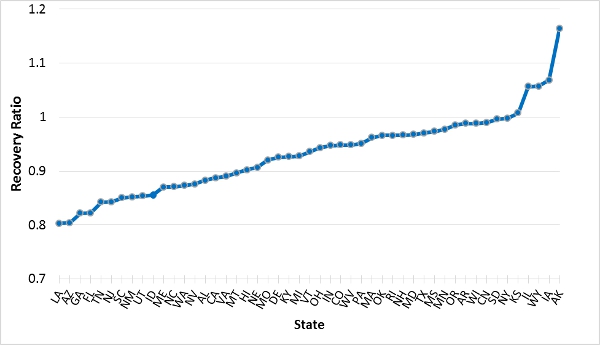
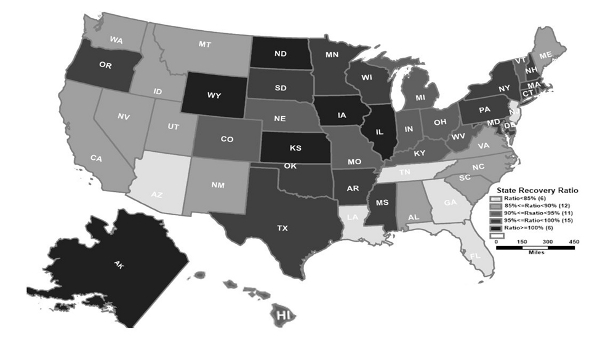
To measure revenue recovery, we first computed the ratio of state government own source revenue (OSR) – which consists of taxes and fees and charges, and excludes federal government grants – in 2012 to OSR in 2007 by state sorted from lowest to highest ratio. By this measure, most (42) states now have recovered, i.e., the ratio exceeds one. To the extent that populations have either changed, a better measure is the ratio of per capita OSR for the two years. By this alternative measure, 31 states have recovered the lost revenue by 2012. However, inflation has eroded revenue, and so our preferred measure uses the ratio of real OSR per capita for the two years (Figure 1). (Note that North Dakota is excluded in Figure 1 because it is such an extreme positive outlier.) This measure averages only 0.95 across all 50 states, ranges from 0.803 (Louisiana) to 2.047 (North Dakota), and only 6 of the 50 states have fully recovered from the Great Recession. We call this ratio the RecoveryRatio. As shown in Figure 2, there is no discernable regional pattern in the RecoveryRatio.
Figure 1 – State Revenue Recovery

Source: Computed by authors. Note that North Dakota is excluded.
Figure 2 – RecoveryRatio by State

Source: Computed by authors.
Explanations for State Government Revenue Recovery
In an attempt to explain these patterns we considered factors that one could argue are causal (e.g., growth in the state’s economy), and also in factors that are simply associated or correlated with revenue recovery. Any correlation coefficient greater than 0.25 is statistically significant at better than the 10 percent level. (Note again that we have excluded North Dakota.)
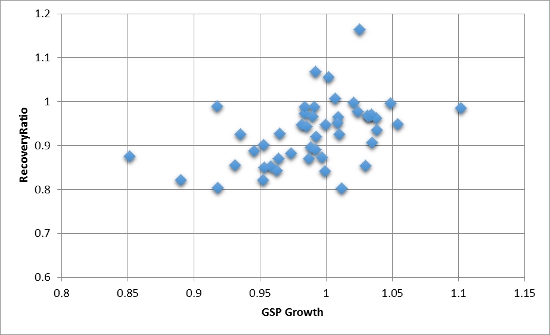
State Economic Growth. The most obvious reason for revenues not recovering is that the state’s economy has not recovered. We calculate the ratio of 2012 state real per capita gross state product to that for 2007, which we denote GSPGrowth. As expected,the RecoveryRatio is positively correlated with GSPGrowth, with a correlation coefficient of 0.41. Figure 3 shows a scatter plot between the RecoveryRatio and GSPGrowth.
Figure 3 – State Economic Growth and RecoveryRatio

Source: Computed by authors. Note that North Dakota is excluded.
State Economic Structure. Specific features of a state’s economy may have affected state government revenue recovery. Here we use Bureau of Economic Analysis (BEA) data to calculate the 2007 shares of wage and salary employees in farming, mining, oil and gas, construction, and manufacturing.
Farming would seem to be a stable source of employment, but the correlation coefficient between the share of employment in farming andthe RecoveryRatio is very small (-0.03). Our expectation is that states in which mining, and in particular oil and gas, is relatively important would have higher values ofthe RecoveryRatio; in fact, the correlation coefficients are 0.31 and 0.37, respectively. Given that the Great Recession is associated with a significant decline in construction, we expect that revenue recovery would be negatively correlated with pre-recession construction employment. Consistent with this expectation, the correlation coefficient is -0.37. Finally, the importance of manufacturing is positively correlated with RecoveryRatio, but the correlation coefficient is small (0.12).
The housing boom and bust differentially affected states, so states with substantial foreclosures may have had difficulty recovering to their pre-recession revenue. The correlation coefficient between per capita foreclosures, as reported by RealtyTrac, andthe RecoveryRatio is negative as expected (-0.30).
Tax Composition and Policy. The structure and composition of state taxes may also affect revenue growth, given that taxes differ in their income elasticity. We calculate the share of own source revenue from various revenue sources for 2007, and we find that states that rely more heavily on sales taxes have experienced smaller revenue recoveries, while personal income tax share of OSR is not correlated with revenue recovery. The correlations between the RecoveryRatio and the share of OSR from sales taxes and personal income taxes are -0.38 and ‑0.05, respectively.
Political and Policy Factors. The actions that a state might take to recover are likely to differ based on the political orientation of the state government, and in particular the political party in control. We expect that a Republican-controlled state would be less likely to raise taxes. However, the correlation between a Republican-controlled state government in 2007 and the RecoveryRatio is only -0.05. While not statistically significant, the sign is negative, contrary to expectations. Of course, a crucial consideration is whether discretionary government policy may affect the revenue recovery of state, or even that of local governments. In particular, state tax policy may be relevant, and revenue recovery may be larger if the state adopted discretionary tax changes. However, we find little evidence that discretionary tax increases had any significant impact on the RecoveryRatio. We also find that the presence of a tax limitation had little effect on the RecoveryRatio.
Demographic Factors. Finally, demographic characteristics of the population may matter, including age (percentage under 18), education (percentage with at least a BA degree), race (percent white), and the poverty rate, all measured as of 2007. Other than percent poor in 2007, which has a correlation coefficient of -0.27, the correlation coefficients for the other demographic variables are small and statistically insignificant.
We also conducted regression analysis in which the RecoveryRatio is the dependent variable and various explanatory variables are included, as suggested by the correlation coefficients. These regression results are not reported here, but in general these results are consistent in terms of sign and statistical significance with the correlations reported above. For example, the coefficient on GSPGrowth implies that a one percentage point increase in state economic growth is associated with only a 0.41 percentage point increase in state revenue recovery.
It seems likely that state government revenues are largely at the mercy of broader economic trends beyond the immediate control of these subnational governments. This conclusion does not mean that specific discretionary policy changes – economic development strategies, education reforms, tax and expenditure limitations, tax reforms and tax changes, and the like – have no impact on the state budgets, especially if these policy changes affect the economic structure of the state. It also does not deny the potential effects of specific policy initiatives like rainy day funds, which can mitigate the negative impacts of fiscal imbalances. Even so, however, revenue performance often seems driven by factors outside the immediate and obvious control of the state. At this point, any short term recovery in state budgets must largely await national economic recovery.
This article is based on the paper, ‘State Government Revenue Recovery from the Great Recession’ in State and Local Government Review.
Featured image credit: Simon Cunningham (Flickr, CC-BY-2.0)
Please read our comments policy before commenting.
Note: This article gives the views of the author, and not the position of USApp– American Politics and Policy, nor of the London School of Economics.
Shortened URL for this post: http://bit.ly/1s549gD
_________________________________
 James Alm – Tulane University
James Alm is Chair of the Department of Economics at Tulane University. His teaching and research are in the area of public economics, in such areas as tax compliance, the tax treatment of the family, income reporting, and tax reform. He has also worked extensively on fiscal and decentralization reforms overseas.
_
 David L. Sjoquist –Georgia State University
David L. Sjoquist is Professor of Economics and holder of the Dan E. Sweat Chair in Educational and Community Policy in the Andrew Young School of Policy Studies at Georgia State University.


