 The Great Recession, which began in 2008, was an economic upheaval the likes of which had not been seen since the Depression 80 years prior. In a new study which compares the lead-up to the Great Recession with the Great Depression, Michael Kumhof (with Romain Ranciere and Pablo Winant), finds that the growing inequality and the increasing household debt that preceded these crises made them much more likely. He argues that in the lead up to both crises the poorest experienced a massive erosion of their relative income position, and increased borrowing to cope, while the rich accumulated more and more financial assets backed by loans to the poor and the middle class. Applying his model to the near term, he suggests that unless policies are put into place to address income inequality, there will likely be a further increase in debt-to-income ratios for the lowest earners, with an increasing likelihood of further crises.
The United States have experienced two major economic crises during the last century, starting in 1929 and 2008. In each case the pre-crisis decades were characterized by a sharp increase in income inequality, and by a similarly sharp increase in household debt leverage. In new research, we propose a theoretical mechanism that links growing income inequality to growing debt leverage, and ultimately to financial fragility and financial crises. We find that this mechanism can account for around three quarters of the 1983-2008 increase in the U.S. debt-to-income ratio, and therefore for the increased probability of a financial crisis such as the one observed in 2008.
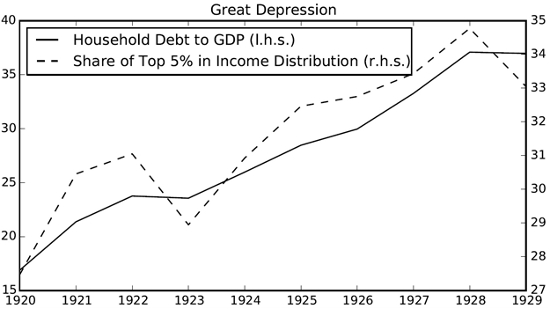
Figures 1 and 2 plot the evolution of the income share of the top 5 percent of U.S. households (ranked by income) against household debt-to-GNP or debt-to-GDP ratios in the decades leading up to 1929 and 2008. The income share of the top 5 percent increased from 27 percent in 1920 to 35 percent in 1928 and from 22 percent in 1983 to 34 percent in 2007. The ratio of household debt to GNP or to GDP approximately doubled between 1920 and 1928, and also between 1983 and 2007, when it reached much higher levels of almost 100 percent.
Figure 1 – Income share of top 5 percent of U.S. households and household debt-to-GNP ratios 1983 – 2008
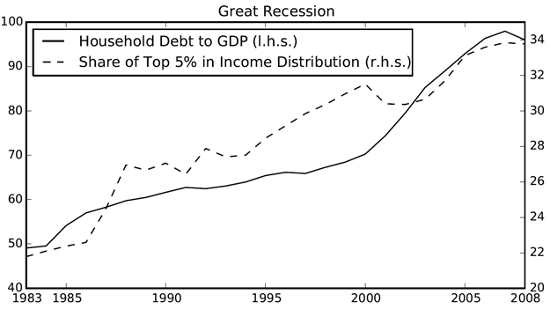
Figure 2 – Income share of top 5 percent of U.S. households and household debt-to-GDP ratios 1920 – 1929
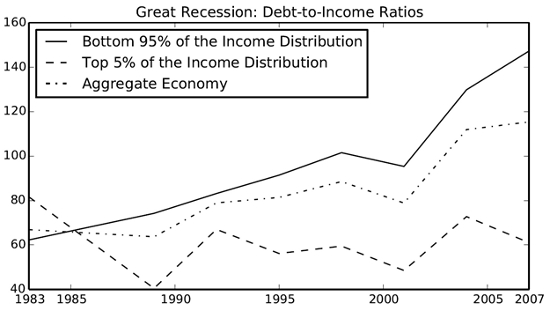
According to standard models of household behaviour, a permanent increase in income inequality, such as the one observed in the decades prior to 2008, should be associated with a similar increase in consumption inequality. However the data show that the increase in consumption inequality has been much more moderate. This implies that poor and middle-class households must have become more indebted, while rich households became less indebted or accumulated financial assets. Figure 3 plots the evolution of gross debt-to-income ratios for different income groups prior to the Great Recession. In 1983, the top 5 percent exhibited a debt-to-income ratio of just over 80 percent and the bottom 95 percent a ratio of just over 60 percent. Twenty five years later, the situation is dramatically reversed, with a ratio of 60 percent for the top 5 percent and almost 150 percent for the bottom 95 percent.
Figure 3 – Gross debt to income ratios across income groups 1983 – 2007
Borrowing therefore helped the poor and the middle class to cope with the erosion of their relative income position. Meanwhile, the rich accumulated more and more financial assets backed by loans to the poor and the middle class. The work of Schularick and Taylor then suggests that, as borrowers’ debt leverage increased, the economy experienced a gradually increasing risk of financial crises.
We use a theoretical model to simulate the effects of the actually experienced shocks to U.S. income inequality (and to U.S. output) between 1983 and 2008. This model has several novel features that are motivated by the stylized facts above. First, households are divided into a top 5 percent and a bottom 95 percent income group. We refer to these groups as top earners and bottom earners. Second, bottom earners make an optimal decision on when to default that trades off the benefits of a reduced debt load against real and psychological costs of default, with a probability of default that never exceeds 10 percent during our simulations. Third, following the “capitalist spirit” specification of Carroll, investors have preferences not just over consumption, but also over the ownership of wealth. This implies that even when top earners experience permanent increases in income, such as the ones observed prior to 2008, they will allocate part of these to higher financial investment, while a conventional consumption smoothing model would suggest that the gains would be allocated exclusively to higher consumption. Higher financial investment in turn represents increased loans back to workers. Fourth, the extent to which top earners wish to allocate their additional income to financial investment is calibrated based on independent microeconomic evidence. This evidence supports the assumption that, at the margin, top earners save 40 cents out of every additional dollar in income.
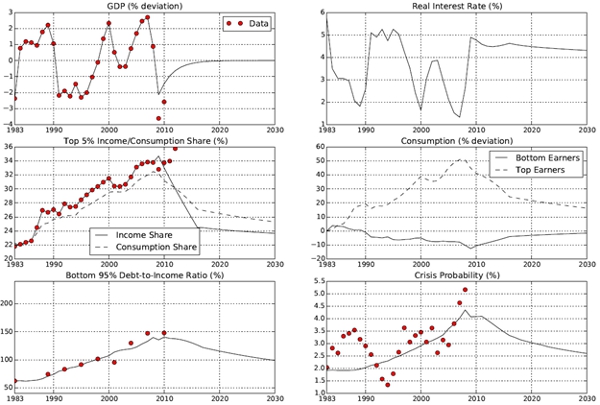
Figure 4 shows our central simulation based on this model. The horizontal axis represents time, with the simulation starting in 1983 and ending in 2030. The circular markers represent U.S. data, while the lines represent model simulations. The simulation ensures that the model matches the data for the top 5 percent income share (and also for GDP) exactly between 1983 and 2008. The top 5 percent income share consists of an output share component and an interest income component, and it is shocks to the output share component which ensure that the model matches the observed increase in the income share. We assume that a crisis, accompanied by transitory output losses, hits in 2009, and that there are no further shocks to the output share after 2009.
Figure 4 – Model simulation of the effects of income inequality
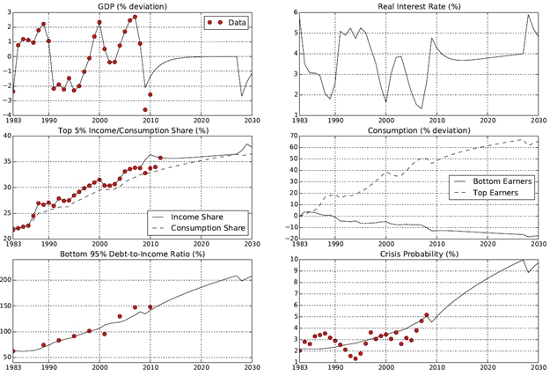
Between 1983 and 2008, top earners save a sizeable share of their additional income in order to lend to bottom earners. Bottom earners’ debt-to-income ratio therefore increases from 62.3 percent in 1983 to 138.8 percent in 2008, accompanied by an increase in crisis probability from 2.2 percent in 1983 to 5.1 percent in 2008. The model matches the debt-to-income data very well, it can account for around three quarters of the observed increase in debt. This is despite the fact that the model’s calibration is based on independent microeconomic evidence, and is therefore not designed to match debt-to-income ratios.
For the future, the model predicts a further increase of the income share of top earners, because the preceding shocks to the output share imply further increases in bottom earners’ debt, and therefore in interest income for top earners. As a result, bottom earners’ simulated debt-to-income ratio increases from around 140 percent to around 180 percent over the post-crisis decade, accompanied by an increase in crisis probability from around 5 percent to around 8 percent. This makes further crises increasingly likely. Figure 4, which is based on a particular sequence of future shocks to the perceived cost of defaulting, shows one such crisis in 2028.
The effect of the crisis on bottom earners’ debt-to-income ratio in the model is modest, it only drops by around 4 percentage points on impact and then immediately resumes its upward trajectory. The reasons include the continuing upward trend in top earners’ financial wealth accumulation, the output costs of the crisis, which are mostly borne by bottom earners, and an interest rate on the remaining debt that shoots up and temporarily raises debt servicing costs.
Given this very limited effect of crises on debt loads, there is only one possibility for a successful and lasting deleveraging of households. The simulation in Figure 5, which is identical to the baseline until 2008, illustrates this. This simulation assumes that in 2009 top income shares start to experience a sustained and ultimately complete reduction back to their pre-1983 levels. Unlike in the baseline scenario, post-2009 debt does not merely experience a transitory reduction due to the crisis but goes on a sustained downward path, because bottom earners now have the means to pay down their debt over time. This also reduces crisis probability, and very substantially. The reason is that debt in the baseline had reached such high values that the crisis probability had become much more sensitive to further increases in debt. Reductions in income inequality fairly quickly take the economy out of that danger zone. As a result, by the late 2020s financial fragility has been reduced to such an extent that the 2028 crisis of the baseline simulation no longer occurs. Any success in reducing income inequality could therefore play a very important role in reducing the likelihood of future crises.
Figure 5 – Model simulation of the effects of income inequality with fall in top income shares to pre-1983 levels
This article is based on the paper ‘Inequality, Leverage, and Crises’ in the American Economic Review.
Featured image credit: GotCredit (Flickr, CC-BY-2.0)
Please read our comments policy before commenting.
Note: This article gives the views of the author, and not the position of USApp– American Politics and Policy, nor of the London School of Economics or those of the Bank of England.
Shortened URL for this post: http://bit.ly/1JEjGP3
_________________________________
 Michael Kumhof – Bank of England
Michael Kumhof is Senior Research Advisor in the Bank of England’s Research Hub. His recent work has focused on the role of banks in the macroeconomy, the role of income inequality in causing economic crises, and the impact of potential fossil fuel supply limitations on the world economy.




Very intuitive argument — makes sense — the one areas i might add to the argument was the impact of financial market liberalization — it eased access to credit during the 1980s, helping to fuel the credit explosion. Let me know if you decide to update this analysis — I found your description of the debt ratios/income segments particularly helpful. Thanks.